
Report outlining results of the Horizontal Evaluation of the Oceans Protection Plan at Transport Canada.
On this page
Acronyms and abbreviations
-
BMP
-
Building Meaningful Partnerships
-
CCG
-
Canadian Coast Guard
-
CEMS
-
Cumulative Effects of Marine Shipping
-
CRF
-
Coastal Restoration Fund
-
CSAP
-
Collaborative Situational Awareness Portal
-
DFO
-
Department of Fisheries and Oceans
-
ECCC
-
Environment and Climate Change Canada
-
EMSA
-
Enhanced Maritime Situational Awareness Platform
-
FY
-
Fiscal Year
-
HC
-
Health Canada
-
HE
-
Horizontal Evaluation
-
HEWG
-
Horizontal Evaluation Working Group
-
HR
-
Human Resources
-
ICBVP
-
Indigenous Community Boat Volunteer Program
-
IM/IT
-
Information Management/Information Technology
-
IRP
-
Indigenous Relations and Partnership
-
MTP
-
Marine Training Program
-
NIM
-
National Integration Model
-
NRCan
-
Natural Resources Canada
-
Oceans RFA
-
Reconciliation Framework Agreement for Bioregional Oceans Management and Protection
-
OPP
-
Oceans Protection Plan
-
OPPSES
-
OPP Stakeholder Engagement Solution
-
PDAs
-
Partner departments and agencies
-
POR
-
Public opinion research
-
PVM
-
Proactive Vessel Management
-
TC
-
Transport Canada
-
TMX
-
Trans-Mountain Expansion
-
WCTSS
-
World Class Tanker Safety System Initiative
Executive summary
This report presents the results of the horizontal evaluation undertaken in 2021-2022 of the first iteration of the Oceans Protection Plan (OPP). The first OPP initiative was a largescale, ambitious, and comprehensive program aimed at strengthening the safety, environmental protections, Indigenous partnerships, and scientific knowledge related to Canada’s marine sector. Its activities were jointly implemented by Transport Canada (TC), Fisheries and Oceans Canada and Canadian Coast Guard (DFO-CCG), Environment and Climate Change Canada (ECCC), and Natural Resources Canada (NRCan). OPP funding totaled $1.5 billion over 5 years (fiscal year 2016/17 to fiscal year 2021/22), which, at the time, made it the largest investment ever made to protect Canada’s coasts and waterways.
The OPP horizontal evaluation was led by TC in collaboration with DFO-CCG, ECCC, and NRCan. The primary objective of the evaluation was to assess progress towards the achievement of intended outcomes across the four partner departments and agencies (PDAs) and all OPP activities from 2016 to 2021. Given that funding for many OPP activities has been renewed for an additional 5 to 9 years through Budget 2022, the evaluation placed special emphasis on identifying lessons and practices that could potentially inform the upcoming implementation of the renewed and enhanced OPP.
The evaluation assessed relevance, design, federal collaboration, implementation factors, progress and results, Indigenous inclusion, stakeholder engagement, and best practices/lessons learned. Data collection methods included key informant interviews, an internal survey, an environmental scan, a review of documents related to Indigenous inclusion, a results assessment, and financial analyses. From an analysis of these data, the following key evaluation findings emerged:
Finding 1: The OPP successfully met several key needs among PDAs, Indigenous groups, and stakeholders; the gaps that remain highlight the initiative’s ongoing relevance.
PDAs received funding through the OPP that supported their core mandates and bolstered marine and environmental programming, while many of its sub-initiatives opened avenues for Indigenous groups to participate more meaningfully in the marine sector and provided direct and indirect benefits to stakeholders. Gaps in meeting the needs of PDAs, Indigenous groups, and stakeholders arose mainly from A) the initiative’s primary focus on West Coast activities and priorities, B) the lack of advance inclusion of Indigenous groups in program design/planning, and C) the discovery of new needs and the creation of new expectations among Indigenous groups and stakeholders during the implementation of the OPP.
Finding 2: While the OPP’s design was innovative and comprehensive, it lacked an overarching narrative linking its diverse initiatives together in pursuit of longer-term strategic outcomes.
The OPP was highly ambitious, with 50+ sub-initiatives aimed at addressing diverse aspects of safety, environmental protection and restoration, science and technology, and Indigenous collaboration in the marine sector. Although this ambition was a strength in many ways, PDAs, Indigenous groups, and stakeholders often struggled to maintain a clear understanding of how individual activities connected to each other or to the OPP’s high-level goals. This lack of a common unifying narrative hindered coordination and contributed to siloed approaches within and between PDAs.
Finding 3: The OPP’s strong focus on West Coast concerns and priorities was at odds with its comprehensive branding, contributing to dissatisfaction among some Indigenous groups and stakeholders.
Many OPP sub-initiatives were designed to address priorities and concerns related to increased shipping and the transportation of oil on the West Coast, resulting in a higher concentration of activities and investments in the Pacific compared to other regions. While this was an intentional design choice, the discrepancy created dissonance with the OPP’s branding as a Canada-wide, comprehensive marine protection initiative, contributing to a sense of dissatisfaction among Indigenous groups and stakeholders in other regions as well as those with differing safety and environmental priorities.
Finding 4: Internal services and Indigenous groups had limited opportunities to provide input into program planning and development, leading to underestimations of the time and resources required for some activities.
Time constraints during the OPP’s planning phase meant that many of its sub-initiatives were developed quickly and in a centralized manner, with limited consultation opportunities for internal services or Indigenous groups. Because of the time pressures and the complexity of the OPP, the time and resources needed by enabling functions such as Human Resources (HR) and Information Management/Information Technology (IM/IT) to support OPP activities were underestimated. Similarly, the lack of advance engagement with Indigenous groups led to underestimations of the investments required for meaningful Indigenous inclusion. These factors contributed to a slow start for some projects and hindered relationship-building efforts during the OPP’s early implementation.
Finding 5: Strong federal collaboration was critical to the implementation of many OPP activities. While collaboration within PDAs was generally effective, horizontal dynamics were more challenging.
A defining feature of the OPP was its dependence on effective horizontal relationships to achieve intended outcomes. PDAs’ differing mandates, cultures, and communication styles sometimes impeded efforts to collaborate. However, there are early indications that this situation may be improving as the initiatives mature and experience accrues within the federal public service.
Finding 6: There were issues coordinating and tracking engagement and partnership activities in a consistent and reliable manner, which placed strain on Indigenous groups and stakeholders. Many improvements to the engagement process occurred as the OPP matured, but opportunities for improvement remain.
The magnitude of engagement sessions conducted through the OPP (and other related federal initiatives) placed high demands on many partners, especially Indigenous groups. Some partners found the experience of engaging with multiple OPP sub-initiatives to be confusing or uncoordinated, straining their ability to participate. Although PDAs have recognized this problem and begun working to streamline the engagement process, opportunities for improvement remain.
Finding 7: OPP staff were agile and effective in responding to significant changes over the course of the OPP implementation, reflecting the program’s spirit of flexibility and experimentation.
The OPP was a space that encouraged transformation and flexibility, giving staff the ability to pilot new approaches, respond to feedback from partners, and adapt to challenging and evolving circumstances (such as the COVID-19 pandemic). This working-level agility was recognized as a strong success factor for the initiative’s implementation by internal and external interviewees.
Finding 8: Despite the challenges associated with the early implementation and delays caused by the pandemic, the OPP had significant positive impacts and made tangible progress in key thematic areas.
Many OPP sub-initiatives experienced delays due to: A) the impact of the COVID-19 pandemic on engagement activities, field work, and legislative processes, B) the initial miscalculations of key enabling requirements (e.g., the time it would take to hire and train staff, limited capacity for data storage/management), and C) the underestimations of the time and resources required to support meaningful Indigenous inclusion. Despite these challenges, PDAs made significant progress through key activities that strengthened marine safety, ecosystems protection and restoration, Indigenous inclusion, and scientific knowledge.
Finding 9: The OPP started an important foundation for longer-term work by building relationships, identifying gaps, developing skills, and strengthening scientific knowledge related to the marine sector.
The OPP can be seen as an effective first step in the ongoing process of modernizing and strengthening Canada’s marine system and has laid the groundwork for future activities in this area by: A) developing relationships and working to establish trust with Indigenous groups and stakeholders, B) identifying gaps and reinvesting in core priorities, C) building up the requisite knowledge, skills, and experience within the federal public service, and D) collecting critical data to inform marine decision-making.
Finding 10: While performance information was helpful for project management and decision making, reporting requirements placed a significant burden on working-level OPP staff and did not always provide a meaningful assessment of strategic progress.
The quantity and detail of performance information collected under the OPP allowed senior staff to effectively monitor progress and make informed decisions. However, heavy oversight and reporting requirements (especially in the early days of the OPP’s implementation) were sometimes seen as pulling resources away from project delivery. In addition, performance metrics did not always align well with activities at the working level.
Finding 11: Although Indigenous engagement was a key priority for many OPP initiatives, Indigenous groups were often seeking a deeper level of collaboration than PDAs were prepared to accommodate.
Many OPP activities were well matched to the goals and priorities of Indigenous communities and organizations. However, efforts on the part of PDAs to shift towards new ways of collaborating with these groups in the marine sector have been inconsistent and challenging. Limited resources, capacity constraints, administrative barriers, and concerns surrounding the inclusion of external groups in insular departmental design and decision-making processes have prevented the OPP from fully meeting Indigenous needs, leading to tension and frustration in some cases. Going forward, Indigenous groups have expressed a clear expectation to be treated as full partners (not just a special category of stakeholders) in developing and delivering marine programming that impacts their rights and territories.
Based on these findings, the following recommendations are made:
- Indigenous capacity and meaningful collaboration
- Recommendation: It is recommended that TC, in collaboration with OPP PDAs, develop and implement a strategy/approach to enhance the coordination and tracking of engagement sessions with Indigenous groups and stakeholders.
- Rationale: A coordinated and consistent approach to engage with Indigenous groups and stakeholders will be important for the renewed OPP to ensure the effectiveness of the engagement efforts and to alleviate capacity strain. Existing tools like the National Integration Model (NIM) and the OPP Stakeholder Engagement Solution (OPPSES) have been effective and there is potential to utilize and enhance the uptake of these tools, as a component of such an approach.
- Results chain/narrative
- Recommendation: It is recommended that TC, in collaboration with OPP PDAs, ensure that a comprehensive results chain and narrative (which includes outcomes, performance indicators, targets, and a data strategy) for the renewed OPP is available and disseminated once the initiative is launched.
- Rationale: Having this tool will provide a variety of benefits. Internally, a logical and well-defined results chain with an accompanying narrative should allow OPP staff to easily comprehend the interconnections between activities and how they contribute to the achievement of long-term results. Further, a well-developed results chain/narrative should help to rationalize reporting requirements, enhance staff engagement, allow the program to gauge the OPP’s performance continuously, enhance agile decision making, and facilitate external communications related to the achievement of results to partners, central agencies, and the Canadian public.
- Horizontal collaboration/communication
- Recommendation: It is recommended that TC, in collaboration with OPP PDAs, develop and/or enhance tools to facilitate collaboration and communication between and within departments to ensure that OPP staff are kept abreast of changes to the OPP organizational structure, changes in personnel, and key decisions taken by senior managers that could impact their work.
- Rationale: These tools would facilitate effective collaboration among internal partners, and could include, but are not limited to, developing and routinely updating a contact list for all OPP sub-initiatives, expanding upon the routine communications sent by departmental Communications teams (e.g., the “OPP Comms Calendar of the Week”), or having OPP secretariats launch a centralized and integrated forum with representatives from all PDAs and from all departmental regions.
1.0 Program profile
In 2016, the Prime Minister announced $1.5 billion to fund the Oceans Protection Plan (OPP) over 5 years (2016/17 to 2021/22), which at the time was the largest investment the Government of Canada had ever made to protect its coasts and waterways. The OPP was envisioned as a comprehensive, transformative strategy to build a world-leading marine safety system and protect Canada’s marine ecosystems. This strategic outcome is supported by four main pillars, each with its own set of shared outcomes and associated initiatives:
- State of the Art Marine Safety System (14 initiatives)
- Preservation and Restoration of Marine Ecosystems (4 initiatives)
- Indigenous Partnerships (2 initiatives)
- Stronger Evidence Base, and Increased Community Participation and Public Awareness (3 initiatives)
Given the broad scope of activities associated with some of these initiatives, many were further broken down into separate (but interrelated) sub-initiatives; for example, the Comprehensive Strategy for Vessels of Concern initiative consisted of 6 sub-initiatives addressing various aspects of owner identification and remediation, risk-based strategizing, vessel removal, education and outreach, and research into recycling and design. Management and reporting for the OPP was generally done at the sub-initiative level.
In total, the first iteration of the OPP consisted of 57 sub-initiatives which were implemented by the four OPP partner departments/agencies (PDAs): Transport Canada (TC), Fisheries and Oceans Canada and Canadian Coast Guard (DFO-CCG), Environment and Climate Change Canada (ECCC), and Natural Resources Canada (NRCan); see Table 1. Full details of the OPP’s initiatives and sub-initiatives including intended outcomes, performance indicators, and funding amounts can be found in Appendix A.
| PDA | Sub-initiatives led | Sub-initiatives contributed to |
|---|---|---|
| TC | 26 | 6 |
| DFO | 10 | 3 |
| CCG | 19 | 9 |
| ECCC | 2 | 3 |
| NRCan | - | 1 |
1.1 Geographic and political context
The OPP operates within the context of other high-profile federal government priorities and initiatives, including the Reconciliation Agenda and the Trans Mountain Pipeline Expansion (TMX) project. In the years leading up to its development, high-profile marine incidents (such as the near grounding of a Russian cargo vessel off the coast of Haida Gwaii in 2014Footnote 1 and the Marathassa oil spill in English Bay in 2015Footnote 2) combined with the anticipation of increased shipping activity from TMX and other energy infrastructure projects contributed to an environment of heightened concern around the safety and sustainability of marine activities on the West Coast, particularly within Indigenous groups and coastal communities. Previous investments in marine safety and spill preparedness made through the World Class Tanker Safety System Initiative (WCTSS; 2013-2016), while significant, were insufficient to fully address public, provincial, and Indigenous concerns in this area. Given this context, the OPP was designed to build upon work completed under the WCTSS to:
- Help restore public confidence in Canada’s marine safety system to protect coastal ecosystems from the impacts of increased shipping,
- Address potential impacts to Indigenous rights and interests for the TMX project through the implementation of marine-based accommodation measures related to environmental protection and marine safety,Footnote 3 and
- Respond to several other broad federal objectives and 2016 mandate letter commitments, including pursuing reconciliation with Indigenous groups, delivering the moratorium on Crude Oil Tanker Traffic on BC's North Coast, re-establishing the Maritime Rescue Sub-Centre in St. John's, Newfoundland, and achieving benefits for groups that were traditionally underrepresented in the marine sector.
The OPP provided funding for a diverse set of activities related to marine health and safety, ranging from increasing access to real-time marine traffic and weather data, conducting research into oil spill clean-up technologies, restoring coastal ecosystems, and creating a greater role for Indigenous groups in the marine safety regime. While many aspects of this work were already underway within individual departments, the OPP’s comprehensive branding cut across multiple mandates and prompted new levels of horizontal coordination. At the same time, the initiative’s ties to TMX and the Reconciliation Agenda demanded a much stronger focus on engagement and partnerships with Indigenous groups.
2.0 Evaluation background
The Horizontal Evaluation of the OPP (OPP HE) was led by TC in partnership with DFO-CCG, ECCC, and NRCan. Working-level collaboration with evaluation partners was coordinated through a Horizontal Evaluation Working Group (HEWG) whose members provided input and expertise and facilitated access to key contacts and information from within their departments. The formal planning for the OPP HE was launched in May 2021, with the final Evaluation Plan approved by Heads of Evaluation in all four PDAs in October 2021. The evaluation was conducted between December 2021 and March 2022.
A key contextual factor to consider for this evaluation is that the conduct phase occurred in parallel with the development and approval of OPP renewal documents (as well as Budget 2022). As such, at the time of writing, work may already be underway to address certain issues flagged in this report. Where possible, findings and recommendations that are particularly relevant to the upcoming implementation of the renewed OPP are emphasized. Other findings have been included for their potential value in informing similar large federal initiatives in the future.
2.1 Objective and scope
The aim of this evaluation was to critically examine progress towards OPP outcomes across all 57 sub-initiatives. The scope of the evaluation covered the period from the OPP’s early implementation in April 2017 to March 2021; however, in some cases, more recent data (up to March 2022) was also considered. The following evaluation questions were examined:
- Relevance: To what extent is the OPP meeting the needs of PDAs, Indigenous groups, and stakeholders?
- Design: To what extent was the OPP designed in a way that would facilitate the achievement of its intended outcomes?
- Federal Collaboration: To what extent has collaboration within and between OPP PDAs been successful in terms of achieving results?
- Process/Implementation: To what extent was the OPP implemented in a way that would facilitate the achievement of its intended outcomes?
- Progress & Results: To what extent has the OPP made progress towards its intended strategic outcome and shared outcomes?
- Indigenous Inclusion: How were Indigenous communities and organizations included within the OPP?
- Stakeholder Engagement: How did PDAs engage and partner with stakeholder groups?
- Lessons Learned: What best practices and lessons learned does the OPP offer for future planning of similar federal horizontal initiatives?
The full evaluation matrix including sub-questions and indicators can be found in Appendix B.
2.2 Methodology and limitations
Data collection for this evaluation consisted of:
- key informant interviews,
- an internal survey of OPP staff,
- an environmental scan and general document review,
- a targeted review of materials related to Indigenous inclusion,
- an assessment of progress towards the OPP’s intended results, and
- financial analysis.
Methods and limitations for each of these lines of evidence are described below.
Key informant (KI) interviews
Sixty-eight individual and small group interviews were conducted between December 2021 and March 2022, including 44 with internal informants (see Figure 1) and 24 with external informants (see Figure 2). In total, 104 interviewees were consulted through this process.
Figure 1. Internal interviews by PDA

Text version
This pie chart shows the breakdown of interviews with internal informants by OPP partner department/agency. Fifty-five percent of interviews were conducted with TC informants, 36% with DFO-CCG informants, 7% with ECCC informants, and 2% with NRCan informants.
Figure 2. External interviews by region

Text version
This pie chart shows the breakdown of interviews with external informants by region. Thirty percent of interviews were conducted with Atlantic informants, 26% with Pacific informants, 18% with Quebec informants, 13% with Arctic informants, and 13% with Ontario informants.
The number and diversity of OPP activities presented challenges for the evaluation, as it was not possible to interview all potential informants. To ensure adequate coverage of perspectives, internal interviewees were selected via a combination of purposive and stratified random sampling, with HEWG members providing corrections and additions as necessary. External interviewees were identified by requesting suggestions of key stakeholders from regional engagement staff and consisted of key contacts from industry groups and private companies (33% of interviews), environmental non-governmental organizations (NGOs; 21%), marine authorities (e.g., port and pilotage authorities; 21%), other levels of government (13%), research and academic institutions (8%), and external subject matter experts (4%).
All interview notes were coded using the qualitative analysis software NVivo.Footnote 4 Likert-type rating scales were used in addition to open-ended questions to initiate discussion during interviews. See Appendix C for a full list of internal and external interview questions.
Quotes from internal and external interviews are presented throughout the text of this report without attribution. In some cases, the original wording has been changed slightly to increase clarity or preserve the confidentiality of interviewees.
On the advice of program staff, a decision was made not to reach out directly to Indigenous groups for interviews during the evaluation’s conduct phase given:
- The issue of widespread capacity strain within many Indigenous communities, including competing demands from other federal programs and engagement activities;
- The wealth of pre-existing materials capturing Indigenous perspectives on the OPP; and
- The potential redundancy with other engagement activities, including forward planning processes for OPP renewal (which had recently sought feedback from partners on similar issues).
Instead, views of Indigenous groups were assessed using secondary data (see Review of documents related to Indigenous inclusion below). While this review supplemented PDA-authored sources with publications from Indigenous organizations, documented input from partners in their own words, and results of third-party research with Indigenous respondents, this absence of direct engagement is still an important limitation for the evaluation and should be kept in mind when interpreting the findings and recommendations contained in this report.
Internal survey
A confidential online survey was sent to OPP staff in all four PDAs through the secure web-based platform SimpleSurvey.Footnote 5 A total of 346 participants were invited via email to complete the survey online between February 24 and March 31, 2022. A response rate of 30% resulted in 105 completed responses which were then downloaded, cleaned, and analyzed in Microsoft Excel. Figure 3 presents the departmental breakdown of survey respondents. Survey questions (see Appendix D) closely matched the questions posed to internal interviewees, including rating scales and options to enter long-form responses. Additionally, respondents were asked to rate the degree of challenge created by various implementation factors.
Figure 3. Survey respondents by PDA

Text version
This pie chart shows the breakdown of internal survey respondents by OPP partner department/agency. Forty-seven percent of respondents were from DFO-CCG, 46% were from TC, 6% were from ECCC, and 1% were from NRCan.
Internal survey data is represented through graphs and percentages (rounded to the nearest whole number) throughout this report. Given its more limited role in the OPP, there were not enough NRCan respondents to allow for meaningful comparison with other PDAs; for this reason (and to preserve respondents’ confidentiality), NRCan data is not included in subsequent graphics that compare survey results between PDAs.
While survey results provided a useful snapshot of the relevance, design, expected results, and collaboration from the perspective of OPP staff, there were several issues that likely affected the response rate. These included a technical error with the survey link (which was resolved after respondents brought it to the evaluation team’s attention), the timing of the survey overlapping with March break in some provinces, and departments’ availability during the end of the fiscal year and the drafting of OPP program renewal documents. The survey deadline was extended beyond the originally planned closing date to mitigate these issues.
Review of documents related to Indigenous inclusion
Materials related to Indigenous inclusion were identified through targeted requests made to engagement and program staff within TC (50 documents) and DFO-CCG (146 documents); while ECCC and NRCan were referenced in many of these materials, separate document requests were not made through these departments given their lower involvement with OPP engagement activities. Submissions included internal reports, project charters, summaries of best practices and lessons learned, engagement statistics, public opinion research (POR), media items, records of discussion from various engagement activities, and external publications. Supplemental information and materials identified by the evaluation team through internal queries and internet searches were also included where relevant. From an initial scan of these materials, key documents were identified for in-depth review. Others were imported into NVivo and scanned for relevant content using the software’s query function.
It should be noted that Inuit, First Nations, and Métis groups with interests in the marine sector have varied perspectives and priorities based on history, culture, geography, internal capacity, Aboriginal or Treaty rights, and other factors. While the evaluation team tried to extract common themes where appropriate, the findings in this report do not represent the full range of Indigenous views on the OPP. In particular, the perspectives of groups who were either unable or unwilling to engage with PDAs are not included here.
Environmental scan and general document review
Over the course of the OPP’s 5-year delivery, a variety of related horizontal evaluations, departmental evaluations, audits, and research activities were conducted to address specific information needs among PDAs. Key examples included:
- OPP Case Studies: Lessons Learned (TC-led, 2021);
- Evaluation of the Environment and Climate Change Canada components of the OPP (ECCC, 2021);
- Evaluation of the OPP (Phase 1) (DFO-CCG, 2019).
Along with related federal initiatives and core program documentation, these reports provided a wealth of useful information to support the OPP HE. The evaluation team conducted a review of approximately 34 documents, which were analyzed in relation to the assessment criteria and evaluation questions.
Results assessment
The evaluation team analyzed content from OPP placemats, sub-initiative results templates, project charters, public reports, POR, and audits to assess progress towards intended results, with a particular focus on:
- the six performance indicators developed to track progress on the OPP’s strategic outcome (A world-leading marine safety system for Canada’s three coasts that protects marine ecosystems; see below),
- high level summaries of tangible OPP outputs, and
- sub-initiatives’ reported results.
OPP Strategic Outcome Performance Indicators:
- Number of marine safety incidents and spills from vessels in Canada’s waters
- Percentage of projects funded through Coastal Restoration Fund contribution agreements leading to rehabilitation of aquatic habitats
- Number of vessels of concern addressed
- Number of Indigenous groups that participate in Canada’s marine safety system
- Percentage of policies and operational response plans developed through OPP that are supported by scientific, local/traditional, and other relevant information/knowledge
- Percentage of Canadians who are confident in Canada’s marine safety system
While the reviewed documentation provided reasonably strong reporting of outputs at the sub-initiative level, the results reporting for the OPP’s short-term outcomes (i.e., sub-initiatives’ shared outcomes), medium-term outcomes, and long-term outcome, was not as strong, which constrained the evaluation team’s ability to meaningfully assess overall progress towards strategic results.
Financial analysis
To facilitate the financial analysis, PDAs provided the evaluation team with internal financial documentation and contextual information for how resources were used during the implementation of the OPP. Additional summary financial tables for the years 2018-19, 2019-20, and 2020-21 were extracted from Departmental Results Reports published on TC’s website along with general information on the horizontal initiative. These tables included allocated funding, planned and actual spending, and actual results for the corresponding fiscal year, broken down by OPP pillar and PDA. These data were cleaned, aggregated, and analyzed in Microsoft Excel. While this analysis allowed the evaluation team to identify macro-level trends and outliers, the available data did not contain details of concrete results or purchases made at the sub-initiative level, making it difficult to connect the financial analysis to other lines of evidence.
3.0 Findings
3.1 Relevance
Finding 1: The OPP successfully met several key needs among PDAs, Indigenous groups, and stakeholders; the gaps that remain highlight the initiative’s ongoing relevance.
The OPP was designed to address a wide range of marine safety and environmental issues across a variety of groups. For the purposes of the OPP HE, these groups were categorized as follows:
- PDAs: federal partner departments and agencies (TC, DFO-CCG, ECCC, and NRCan)
- Indigenous groups: individual communities and aggregate organizations
- Stakeholders: the Canadian public, industry (private companies and advocacy groups), NGOs, other levels of government, etc.
For a more detailed description of these categories, see Appendix E.
As seen in Figure 4, OPP staff generally viewed the OPP as being most effective in meeting the needs of PDAs. Overall, while 68% of all survey respondents indicated that the OPP was meeting PDA needs to a moderate or great extent, this rating fell to 56% for Indigenous groups and 51% for stakeholders. Perceptions of the OPP’s relevance to different groups varied by PDA, with higher ratings of PDA relevance among respondents from DFO and ECCC compared to CCG or TC. TC respondents held the most positive views of the extent to which the OPP had met the needs of Indigenous groups.
Figure 4. Average relevance ratings by PDA (internal survey data)
Note: NRCan data too limited for meaningful comparison
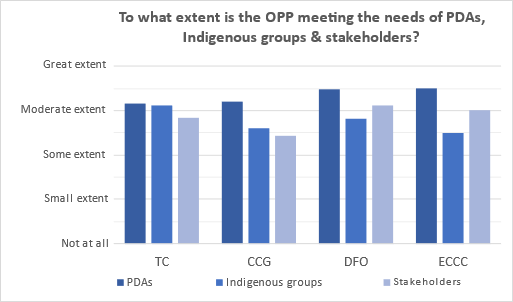
Text version
This bar chart shows average ratings given by internal survey respondents in each OPP partner department/agency (excluding NRCan) in response to the question "To what extent is the OPP meeting the needs of PDAs, Indigenous groups, and stakeholders"? Ratings are presented for three separate categories: PDAs, Indigenous groups, and stakeholders. On a scale from 0 ("Not at all") to 4 ("Great extent"), TC respondents gave an average rating of 3.15 for PDAs, 3.13 for Indigenous groups, and 2.84 for Stakeholders. CCG respondents gave an average rating of 3.2 for PDAs, 2.61 for Indigenous groups, and 2.44 for stakeholders. DFO respondents gave an average rating of 3.48 for PDAs, 2.82 for Indigenous groups, and 3.11 for Stakeholders. ECCC respondents gave an average rating of 3.5 for PDAs, 2.5 for Indigenous groups, and 3 for Stakeholders.
PDAs received significant funding through the OPP that bolstered marine and environmental programming, addressed specific departmental needs, and supported their core mandates. Some examples highlighted through internal informant interviews included:
- funding for TC to increase Canada’s marine influence on the international stage,
- large investments in modernizing emergency response infrastructure and replacing ageing fleet assets within CCG,
- dedicated resources for ECCC to strengthen the evidence base in support of environmental planning and response on the West coast, and
- responding to concerns expressed by the public and Indigenous groups about West Coast energy development.
“We’ve moved lightyears ahead, and it’s really related to the foundation of that investment from OPP.”
In fact, a portion of OPP funding was earmarked to support internal PDA processes and address shortfalls resulting from past budget cuts. One interviewee noted that this reality caused confusion among some Indigenous groups and stakeholders, whose expectations were high following the government’s announcement of 1.5 billion in funding for the initiative.
Activities that were the most effective in meeting the needs of Indigenous groups included those that:
- directly strengthened community-level search and rescue and/or environmental response capacity (e.g., the Indigenous Community Boat Volunteer Program (ICBVP)),
- empowered communities to be directly involved in program development and decision-making (e.g., the Enhanced Maritime Situational Awareness (EMSA) platform), or
- provided opportunities for environmental stewardship through the integration of traditional and local knowledge (e.g., the Cumulative Effects of Marine Shipping (CEMS) sub-initiative).
Despite these positive examples, most internal interviewees felt that Indigenous perspectives on the OPP’s relevance were variable and that much of the work of increasing their participation in the marine sector still lay ahead. Indigenous groups were often looking to be involved earlier in the process of setting marine priorities and designing programs, as full partners and decision-makers rather than just stakeholders; with some exceptions, the OPP fell short of meeting this expectation. Some of the factors that impeded progress with Indigenous groups were partially or completely external to PDAs, including pre-existing capacity challenges within Indigenous groups and the COVID-19 pandemic, which limited in-person engagement. Other challenges reflected planning missteps or misalignment between Indigenous priorities and the PDA norms and processes. For example, the current realities of policy development require confidentiality until proposals are approved by Cabinet. Key gaps and barriers to meeting Indigenous needs are examined in detail in the Design and Indigenous Inclusion sections of this report.
Internal and external interviewees largely agreed that the OPP did not prioritize stakeholders to the same degree as Indigenous groups, leading some stakeholder groups (such as industry) to feel left out from key conversations and processes. However, most interviewees recognized that this disparity was largely by design; in accordance with the OPP’s strong focus on reconciliation, PDAs made strategic decisions to direct limited resources towards engagement with Indigenous groups. While their needs were often secondary, many OPP projects still provided direct or indirect benefits to NGOs, industry, federal authorities, and other groups by creating new funding opportunities and opening up new spaces for dialogue between marine stakeholders. The impacts of the OPP on stakeholders are discussed in the Stakeholder Engagement section of this report.
“There is a stakeholder desire for more, deeper analysis, deeper participation. It’s like Pandora’s box – once you open it, there’s more to do.”
While some very specific needs (such as gaps in Arctic charting data and the need for ongoing maintenance investments for new infrastructure and equipment) were flagged as still outstanding by interview and survey respondents, the most significant gap was the OPP’s strong geographical focus on the West Coast, with more limited resources directed towards activities in other regions. While many OPP projects were geared specifically towards addressing West Coast concerns and priorities, the high price tag for the initiative and its comprehensive branding as a Canada-wide “Oceans Protection Plan” created strong levels of interest across the country. Combined with high-level comments framing the OPP as a path to reconciliation, the resulting appetite for participation among Indigenous communities and other groups sometimes exceeded what PDAs were prepared to accommodate, both in terms of resource availability and limitations imposed by institutional norms and processes. The implementation of the OPP also led to the discovery of new needs and raised expectations among Indigenous groups and stakeholders, setting a new standard for the level and quality of engagement on marine issues. There have been consistent calls for initiatives to be continued and expanded, highlighting the ongoing relevance of OPP activities and the work still to come following OPP renewal.
3.2 Design
Finding 2: While the OPP’s design was innovative and comprehensive, it lacked an overarching narrative linking its diverse initiatives together in pursuit of longer-term strategic outcomes.
The OPP was designed as a comprehensive, transformative, and very ambitious strategy to modernize and strengthen Canada’s marine system, providing space to experiment with new approaches to safety, environmental protection, and increasing the participation of marginalized groups. This led to both opportunities and challenges for PDAs.
Figure 5. Average design ratings by PDA (internal survey data)
Note: NRCan data too limited for meaningful comparison
Text version
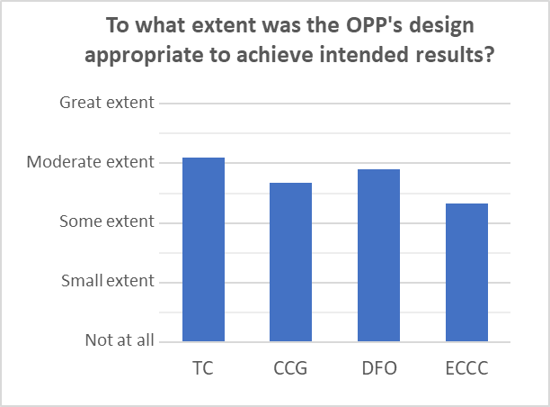
This bar chart shows average ratings given by internal survey respondents in each OPP partner department/agency (excluding NRCan) in response to the question "To what extent was the OPP's design appropriate to achieve intended results?" On a scale from 0 ("Not at all") to 4 ("Great extent"), TC respondents gave an average rating of 3.09; CCG respondents gave an average rating of 2.68; DFO respondents gave an average rating of 2.89; and ECCC respondents gave an average rating of 2.33.
As seen in Figure 5, perspectives on the OPP’s design were mixed. Many internal and external interviewees praised the OPP’s range and ambition in giving PDAs the resources, mandate, and flexibility to address many long-standing issues and pilot new technologies and processes (such as co-development of marine activities with Indigenous communities). On the other hand, some felt that efforts to make the OPP as broad and inclusive as possible resulted in a lack of cohesion between its many diverse activities and sub-initiatives, which were individually valuable, but difficult to link to a single broad policy objective. Connections between some activities were especially abstract/high-level (e.g., between search and rescue activities and environmental restoration projects), making it difficult for PDAs to recognize links and report on shared, bigger-picture outcomes in a collaborative manner. To this point, multiple interviewees suggested that both internal and external groups often struggled to fully grasp how OPP activities connected to each other and to the initiative’s strategic outcomes.
This lack of common understanding ultimately hindered coordination, contributing to siloed approaches within and between PDAs, and added confusion and strain to some Indigenous groups and stakeholders. Many internal interviewees suggested that a clear, intuitive narrative explaining the links in the OPP’s results chain would have helped to emphasize shared goals and progress, while also facilitating the task of communicating the value of the OPP to central agencies, external partners, and the Canadian public.
Finding 3: The OPP’s strong focus on West Coast concerns and priorities was at odds with its comprehensive branding, contributing to dissatisfaction among some Indigenous groups and stakeholders.
Given the strategic decision to use the OPP as a vehicle to address TMX-related concerns, its design closely reflected West Coast priorities and political considerations. Several OPP activities (such as the EMSA and CEMS sub-initiatives) are directly linked to TMX accommodation measures, while others provide key supports for recommendations issued in the Canada Energy Regulator’s Reconsideration Report on the project.Footnote 6
As previously discussed, there was a high concentration of resources, engagement efforts, and pilot projects in the Pacific region. Financial tables developed by the lead department during the OPP’s planning phaseFootnote 7 indicate that close to a quarter of the OPP’s total funding was earmarked for the West Coast compared to 13% for the Atlantic and 14% for the Arctic regions (the remaining 48% were categorized as National investments). In terms of engagement and partnership activities, statistics pulled from TC’s OPP Stakeholder Engagement Solution (OPPSES) database suggested that over 85% of tracked events took place in the Pacific regionFootnote 8 (see Figure 6). Note that these figures do not reflect a full and accurate picture of all OPP engagement as A) OPPSES was only available to TC staff and B) there could have been greater uptake of the tool by West Coast program representatives.
Figure 6. Engagement events by region (OPPSES data)

Text version
This pie chart shows the breakdown of engagement events tracked in OPPSES by region. There were 1276 events in the Pacific, 60 in the National Capital Region, 57 in the Atlantic, 33 in Ontario, 31 in Quebec, 24 in the Arctic, 3 in the Prairies and Northern Region, and 5 events that occurred across multiple regions.
While this element of the OPP’s design was clearly intentional, several interviewees felt that it created dissonance with the initiative’s branding as a comprehensive, national strategy to address marine safety and environmental issues, contributing to a sense of dissatisfaction among some Indigenous groups and stakeholders. Internal sources indicated that certain activities such as engagement were particularly under-resourced outside of the Pacific, placing strain on staff in other regions to do work off the side of their desks in order to meet partners’ needs and expectations. Some external interviewees expressed concerns that in targeting activities to allay public fears about tanker traffic and the transportation of oil (activities which they felt were already highly regulated), the OPP may have expended resources that would have been better spent tackling lower profile, but more impactful, safety and environmental issues (such as ageing sewer systems in coastal cities).
Finding 4: Internal services and Indigenous groups had limited opportunities to provide input into program planning and development, leading to underestimations of the time and resources required for some activities.
“There was a huge push to develop the program very rapidly, so initiatives were developed in a tight circle of people without a lot of broader engagement.”
The design of the OPP was also affected by the need for a quick turnaround and a centralized work environment during its development. Several internal interviewees (including staff who were involved during the planning phase) indicated that, due to the realities of policy development within the federal government, the OPP’s development was rushed and mostly completed in a top-down, internally focused fashion, with limited opportunities for enabling services or Indigenous groups to provide input. As a result, some miscalculations were made in the costing and timelines for key internal enabling functions, which led to challenges during the OPP’s early implementation. While the injection of human and financial resources was helpful to PDAs, the preceding era of cuts and austerity made it difficult for some internal processes like staffing, classification, and IM/IT to meet expectations and align with OPP projections. This observation was corroborated by DFO’s internal evaluation of the OPP’s first phase, which traced key challenges within data-heavy projects to insufficient consultation with IM/IT specialists and regional expertise during planning.Footnote 9 In some cases, mitigation strategies (such as the internal reallocation of funds) were implemented to address these challenges.
“One thing that we should have done differently was budgeted more time for building partnerships. We were naïve about that.”
Many interviewees also felt that the time, expertise, and resources needed for meaningful Indigenous inclusion had been misjudged. This contributed to a slower start than anticipated for initiatives that relied heavily on engagement with Indigenous groups, especially in cases where relations with the federal government and/or specific departments had been strained or non-existent in the past. A case study of the Proactive Vessel Management (PVM) sub-initiative flagged under-estimations of the time required to build collaborative relationships with Indigenous groups as a key challenge,Footnote 10 while survey respondents rated “insufficient time budgeted for building external relationships” as the factor that caused the most difficulties for the OPP’s implementation (with approximately 44% indicating that it had created challenges to a moderate or great extent). Within CCG, engagement functions were not funded with the grants and contributions required to support Indigenous participation, resulting in a need to reallocate resources and leading to uncertainty in budgets from year to year.
In addition to these resource and relationship shortfalls, PDAs were unaware of just how much capacity constraints within Indigenous groups would hinder their ability to participate in OPP activities. As later sections of this report will discuss, this issue was worsened by the push for multiple sub-initiatives to simultaneously establish new relations with Indigenous groups, a task that was not always well coordinated within or between PDAs.
3.3 Process and implementation
3.3A Federal collaboration
Finding 5: Strong federal collaboration was critical to the implementation of many OPP activities. While collaboration within PDAs was generally effective, horizontal dynamics were more challenging.
Effective collaboration within and between PDAs was critical to achieving many of the OPP’s intended outcomes. Over a quarter of its 57 sub-initiatives involved horizontal work, with many others requiring coordination across diverse departmental teams and branches. In general, evidence suggested that while collaboration within departments was fairly effective, horizontal dynamics presented greater challenges. As seen in Figure 7, horizontal collaboration was consistently rated as less effective than collaboration within PDAs by survey respondents. Similar ratings were found for specific elements of collaboration, including governance mechanisms, level of communication, and clearly defined roles and responsibilities (see Appendix F.1 for ratings). Lower ratings for elements of intradepartmental collaboration (particularly roles and responsibilities) were found among respondents from DFO and CCG, likely reflecting the fact that: A) OPP activities were spread widely throughout teams, branches, and regions within DFO-CCG, and B) both DFO and CCG maintain distinct organizational and governance structures, increasing the complexity of coordination. The OPP secretariat within this department/agency was also restructured and moved around several times over the course of the initiative, which may have disrupted oversight and collaboration functions.
Figure 7. Average federal collaboration ratings by PDA (internal survey data)
Note: NRCan data too limited for meaningful comparison

Text version
This bar chart shows average ratings given by internal survey respondents in each OPP partner department/agency (excluding NRCan) in response to the question "To what extent has collaboration been effective?" Ratings are presented separately for collaboration within PDA (i.e., intra-departmental) and collaboration between PDAs (i.e., horizontal). On a scale from 0 ("Not at all") to 4 ("Great extent"), TC respondents gave an average rating of 3.49 for intra-departmental collaboration and 2.63 for horizontal collaboration. CCG respondents gave an average rating of 3.13 for intra-departmental collaboration and 2.53 for horizontal collaboration. DFO respondents gave an average rating of 3.09 for intra-departmental collaboration and 2.48 for horizontal collaboration. ECCC respondents gave an average rating of 3.17 for intra-departmental collaboration and 2.17 for horizontal collaboration.
A key feature of the OPP was the strong horizontal governance structure put in place to ensure coordination and to oversee progress. Many internal interviewees saw the OPP’s governance mechanisms as helpful and effective, providing a strong basis for facilitating collaboration, collecting performance information, and resolving issues among PDAs. Several senior interviewees, in particular, felt that the dashboards and data collected departmentally and through horizontal governance structures met their expectations and were helpful for generating discussion, making decisions, and identifying project delays. However, the value of the horizontal governance and oversight was less clear to working level-staff, some of whom viewed the multiple layers of inter- and intra-departmental governance as cumbersome and struggled to manage the volume of administrative/reporting requirements on top of project delivery. The issue of reporting burden is discussed in detail in the Performance Information section.
Evidence from interviews and internal survey data also suggested that there were issues with communication within the OPP. Information did not always flow consistently between related initiatives, between headquarters and regional staff, or between senior management and the working-level. Multiple internal interviewees mentioned that it was hard to find out who was even leading a given project, and suggested that a centralized, updated record with names and contact information of team leads would have been helpful for OPP staff.
Roles and responsibilities at the horizontal level were also unclear at times, particularly between organizations with linked/complementary mandates. This led to some instances of confusion and/or duplication, including two examples which were documented through the 2021 OPP Case Studies:Footnote 11
- The TC-led EMSA platform (which was co-designed with Indigenous communities as a TMX accommodation measure) and the CCG-led Collaborative Situational Awareness Portal (CSAP) both aimed to increase collaboration with Indigenous groups and enhance communities’ awareness of local marine information. Although originally conceived as separate projects, over time it became clear that they were fulfilling very similar purposes. In 2021, TC and CCG decided to combine resources and move forward with EMSA as the official situational awareness platform.
- The Proactive Vessel Management (PVM) sub-initiative was intended to modernize the regulatory and oversight framework around marine traffic issues through collaborative dialogue forums and pilot projects such as the Haida Gwaii Voluntary Protection Zone.Footnote 12 The initial scope of the PVM was too broad, which created tension and confusion around the respective roles and responsibilities of TC and CCG. These issues were ultimately resolved as activities solidified.
Other horizontal challenges included disagreements about who should be leading certain activities (for example, engagement with Indigenous groups) and the sharing of data between PDAs and with external partners, which was hindered by both technological limitations and reluctance within some departments; on this topic, one internal interviewee noted that the push towards open data and transparency in government was still very much a work in progress.
“The five departments all have different mandates and responsibilities. It was complex. We were like five people trying to achieve the same thing, but in five different ways.”
While these issues were not universal, they were significant enough to prompt one external interviewee to observe that PDAs sometimes seemed to be in competition with each other, especially in the OPP’s early days. Overall, survey and interview respondents seemed to see these horizontal challenges as more systemic than interpersonal, reflecting cultural differences in departmental structures, priorities, and communication styles. In fact, roughly 52% of survey respondents indicated that “difficulties stemming from differing partner department mandates and cultures” created challenges for the OPP’s implementation to a moderate or great extent. This number was especially high among ECCC respondents (83%). Prior to OPP, close collaboration between PDAs had been limited and even difficult in some cases. This, coupled with the sheer size and variety of the initiative and the siloed nature of departments, made it especially hard for individual teams to see how the work they were doing connected to other departments’ activities and the achievement of OPP results.
Other factors that hampered federal collaboration included: A) disparities in the level of time and effort PDAs were able to dedicate to collaboration, reporting, and engagement mechanisms and B) frequent staff turnover. This last factor was especially important given that the success of many OPP activities hinged on strong working relationships, both internal and external. To this point, 40% of survey respondents indicated that “high levels of staff turnover” had created implementation challenges to a moderate or great extent; this number was even higher among CCG respondents (60%). While the rate of turnover was not something PDAs could directly control, the nature of OPP as a time-limited, B-base funded initiative may have prompted staff to view their time working within the OPP as a steppingstone or an avenue for an accelerated promotion before moving on to other things. In this view, having more stable, long-term funding from the outset could have helped staff to see that there was room to grow within the initiative, enhancing recruitment and retention.
“We need that integration within and across departments for all our big environmental questions. There is room for improvement, but it’s been a great success.”
Even with these difficulties, several interviewees (especially at the senior level) felt that navigating the challenges of horizontal work and pulling together over the course of the OPP ultimately led to strengthened relationships, better communication, and increased clarity of roles between PDAs. The skills and momentum developed from working together across departmental boundaries in the OPP were considered strong success factors that would serve PDAs well in the future. As one of the first large initiatives involving close collaboration between these departments, the OPP demonstrated that PDAs could work together as a federal family to pursue complex horizontal goals. Given the new ways of working that the OPP introduced, some amount of friction was inevitable and as one interviewee observed, probably healthy in the long term, in terms of facing and resolving difficult and enduring issues such as those encountered through the EMSA/CSAP and PVM sub-initiatives.
Finding 6: There were issues coordinating and tracking engagement and partnership activities in a consistent and reliable manner, which placed strain on Indigenous groups and stakeholders. Many improvements to the engagement process occurred as the OPP matured, but opportunities for improvement remain.
“You go out one day and meet with an Indigenous group only to find out that another department met with them the previous day. There was consultation fatigue that we could have mitigated.”
Issues with federal collaboration over the course of the OPP also affected progress with partners, particularly Indigenous communities. Many communities are chronically under-resourced to respond to pressures in their territories, and mobilizing the capacity needed to respond to federal requests for consultation and engagement (in terms of time, funding, personnel, and/or technical knowledge) while also managing critical health and environmental issues is an ongoing challenge.Footnote 13 Within the OPP, the magnitude and diversity of engagement and partnership activities represented a significant workload for Indigenous groups in terms of attending meetings, reviewing reports and technical documents, and fulfilling administrative requirements. Although there was a strong appetite to participate in OPP activities, multiple data sources suggested that shortfalls in coordination and losses of institutional memory due to turnover contributed to confusion, frustration, and fatigue among partners, with individual sub-initiatives often pursuing engagement efforts in isolation from each other. In fact, internal survey respondents rated “Coordinating engagement activities with other initiatives, departments, and agencies” as the least effective aspect of Indigenous inclusion within the OPP. This issue was further exacerbated by A) the COVID-19 pandemic, which created new demands on partners’ time and resources, and B) a general lack of understanding about the boundaries between similar and/or linked federal activities. The lack of PDA coordination was also a barrier for non-Indigenous groups, with some external interviewees describing their experience of engaging with multiple departments on the OPP as confusing or disorganized.
Evidence from internal and external sources suggested that PDAs could help to alleviate capacity strain and confusion by:
- Providing longer-term and more flexible sources of capacity funding,
- Streamlining application and reporting processes,
- Maintaining clear and regular communication with partners,
- Sharing reports and documentation in a timely fashion (with plenty of advance notice to review and provide comments), and
- Pursuing a more coordinated approach by enhancing the tracking and sharing of engagement records between sub-initiatives and aligning related engagement and partnership activities (e.g., implementing a single window approach).
To their credit, PDAs recognized many of these issues early on and made efforts to shift towards a more centralized/integrated engagement approach. For example, CCG established Indigenous Relations and Partnership (IRP) units in each region to act as a single window into the department’s OPP activities,Footnote 14 while TC created a new, longer-term source of capacity funding through the Indigenous and Local Communities Engagement and Partnership Program to supplement short-term support available through the existing Community Participation Funding Program.Footnote 15 The lead department also implemented a National Integration Model (NIM) for engagement activities, where separate regional engagement teams with representation from all PDAs were connected through a central national hub and interacted via bi-weekly conference calls and (pre-COVID) in-person workshops.Footnote 16 The NIM was well received internally and considered a valuable avenue for sharing high-level information and lessons learned. However, uptake of this and other coordination mechanisms was inconsistent, and many engagement activities continued to take place in a siloed fashion (at least from the perspective of Indigenous groups and stakeholders). While individual PDA engagement statistics were regularly collected and fed into a central roll-up function at TC for reporting purposes, there was initially no formal mechanism for tracking and sharing detailed engagement data across PDAs, resulting in limited awareness of other departments’ interactions with partners. The OPPSES database, which was originally intended to address this gap, is still a TC-only tool.
3.3B Evolving approaches and other implementation factors
Finding 7: OPP staff were agile and effective in responding to significant changes over the course of OPP implementation, reflecting the program’s spirit of flexibility and experimentation.
“The mindset of a lot of the people working in OPP was very open to trying things out. There were a lot of amazing people who could test what was possible in government.”
Given the challenges associated with horizontal collaboration, a strong success factor for the OPP was the agility and competence of its working-level staff. A key theme emerging from the OPP Case Studies was that many sub-initiatives (such as EMSA, PVM, and the Building Meaningful Partnerships sub-initiative (BMP)) had encountered unexpected challenges which had pushed them to evolve from their original design.Footnote 17 In general, OPP staff were responsive and flexible in managing these changes, and both senior management and external interviewees were impressed with their ability to move projects forward under challenging conditions such as the COVID-19 pandemic, impractical timelines, and the complexities of engagement/partnership processes. One external interviewee observed that the OPP demonstrated a level of flexibility and openness that had not existed before in the federal government, with staff actively listening and adapting their approaches in response to partners’ input. Some examples of this ability to adapt included:
- The creation of the Local Communities Engagement and Partnership Program to supplement existing funding structures and support Indigenous capacity when it became clear that communities were struggling to participate in key activities,
- Engagement staff shifting to presenting at existing industry sector or community meetings rather than organizing new forums and meetings for groups to attend,
- Reallocating extra resources within the OPP envelope to bolster underfunded activities/areas, and
- Rapidly pivoting to remote operations during the COVID-19 pandemic.
These examples speak to the overall spirit of experimentation and willingness to take on risk that characterized the OPP, which seems to have served the initiative well. The license to experiment and explore new approaches also allowed PDAs to explore new co-development and joint governance structures with Indigenous partners, which is discussed in detail in the Indigenous Inclusion section.
Survey and interview respondents identified several other factors that impacted the OPP’s implementation. Unsurprisingly, the pandemic was rated as the biggest challenge to the OPP’s implementation, with 51% of respondents indicating that “delays related to COVID-19” had created a moderate or great degree of difficulty by limiting in-person training and engagement activities (which was often preferred over virtual formats by Indigenous groups), slowing down legislative/policy processes, and delaying construction and field work projects. Sub-initiatives operating in remote and Northern areas were especially hard hit due to existing infrastructure and connectivity issues. Although the COVID-19 pandemic hindered progress overall, a minority of internal respondents pointed out that it also provided opportunities for focused, uninterrupted work and prompted innovative engagement strategies and uses of technology that would probably continue to benefit PDAs in the future. For example, normalizing remote work could potentially expand limited hiring pools for highly specialized and technical positions.
While the pandemic was obviously beyond the control of PDAs, many other hindering factors, such as the underestimation of the human and financial resources needed for enabling functions and the insufficient time budgeted for building external relationships, were linked to issues during the OPP’s planning and design phase. For a full list of hindering and facilitating factors that impacted the OPP’s implementation, see Appendix F.2.
3.4 Progress and results
Finding 8: Despite the challenges associated with the early implementation and pandemic-related delays, the OPP had significant positive impacts and made tangible progress in key thematic areas.
Analysis of dashboards and results templates suggested that just over half of the OPP’s 57 sub-initiatives had met their targets or were expected to do so within planned timelines (see Appendix F.3 for details). These figures aligned with interview data, which reflected a roughly even split between internal interviewees who suggested that targets for their sub-initiative had been met or exceeded and those who flagged a need for more time or resources to deliver on key commitments. According to interviewees and internal documentation, these delays largely reflected the unexpected complexities of engagement and partnership activities as well as the impact of the COVID-19 pandemic.
As discussed, the pandemic impeded the procurement and delivery of goods and services, delayed the achievement of certain milestones, and disrupted the overall implementation of the OPP – particularly for projects that were highly dependent on fieldwork, training, construction, and collaboration with Indigenous groups and stakeholders. The pace of some sub-initiatives was further slowed due to underestimations of the time and resources needed to support internal enabling services as well as conducting meaningful Indigenous engagement. Financial analyses indicated that these delays had a significant impact on the scheduled disbursement of funds within the OPP, resulting in large yearly amounts that needed to be either A) reprofiled to future years, B) reallocated within the OPP envelope, or C) re-directed to similar marine programming needs. From the 2018/2019 to 2021/2022 fiscal year (FY), the OPP spent $1.12B of its $1.51B budget (84%) as planned.Footnote 18 Detailed financial figures can be found in Appendix F.4.
Analyses of internal financial tables indicated that reprofiled/reallocated/redirected amounts within the OPP consisted largely of Contribution and Capital funding, particularly at DFO-CCG and TC. Projects that reported residual funding amounts of $10M or more in these categories were flagged for further analysis.Footnote 19 Out of 9 projects (6 at DFO-CCG, 3 at TC) that fit these criteria, 100% had been classified as needing an extension to complete their deliverables due to impacts from the COVID-19 pandemic, Northern considerations, and/or prolonged negotiations with Indigenous groups. For example, educational institutions receiving funding through the TC-led Marine Training Program were unable to provide placements and hands-on training to students during the height of the pandemic, while a project to install new CCG search and rescue stations was delayed for a variety of reasons, including ongoing negotiations with Indigenous communities and the impact of the pandemic on procurement and construction schedules. To address the fallout from these kinds of disruptions and mitigate the negative impacts on external partners, some PDAs reprofiled existing funding to 2022-23 with a view to completing the delivery of OPP activities within this revised timeframe.
PDAs were active in monitoring and reviewing OPP funding, allowing them to manage resources in an agile/flexible manner. In addition to reprofiling funds to future years within individual projects, this approach allowed them to reallocate funds to bolster other OPP sub-initiatives if necessary and/or to redirect funds to respond to similar marine programming needs. Within TC, funding amounts that were not carried forward or reallocated were managed by Corporate Finance and redirected towards related marine priorities such as the Whales Initiative, the Marine Safety and Security Program, and the National Aerial Surveillance Program. Within DFO-CCG, the OPP Secretariat and Chief Financial Officer’s team collaborated to provide financial oversight for each project, which was reviewed and analyzed on a regular basis; any residual yearly amounts resulting from individual projects were either reprofiled to future years or reallocated within the OPP envelope.
Figure 8. Average progress ratings by PDA (internal survey data)
Note: NRCan data too limited for meaningful comparison

Text version
This bar chart shows average ratings given by internal survey respondents in each OPP partner department/agency (excluding NRCan) in response to the question "To what extent is the OPP on track to achieve intended results?" On a scale from 0 ("Not at all") to 4 ("Great extent"), TC respondents gave an average rating of 3.07, CCG respondents gave an average rating of 3.05, DFO respondents gave an average rating of 3.39, and ECCC gave an average rating of 3.
Despite the significant setbacks associated with the pandemic and other factors, PDAs had generally favourable views of the OPP’s overall progress (see Figure 8). Approximately 71% of survey respondents indicated that the OPP was on track to achieve its intended results to a moderate or great extent, while many internal interviewees shared examples of success stories that illustrated the OPP’s positive impacts in the marine sector, including:
- The co-creation of the EMSA platform: Described by some participants as “reconciliation in action”, the early and ongoing inclusion of partner communities was central to the platform’s success.
- The impact of grants and contributions among partners: Transfer payments through programs like the Coastal Restoration Fund (CRF) allowed NGOs and other partners to collect critical data and rehabilitate aquatic habitats across 8 provinces and territories.
- Enhanced community relations and response capacity through training and infrastructure investments: The Indigenous Community Boat Volunteer, Community Response Training, and CCG Auxiliary programs were effective in bolstering relationships between CCG and participating Indigenous communities.
- Increased monitoring presence in the Arctic: OPP funding empowered Inuit stewardship of Arctic coastlines and even led to an Inuit spotter identifying a pleasure craft contravening COVID-19 restrictions in the Northwest Passage,Footnote 20 providing a strong example of successful federal-Indigenous collaboration.
The document review and interview responses also highlighted many concrete outputs that contributed positively towards increasing the safety of marine shipping, improving emergency response, protecting marine species and ecosystems, advancing collaboration with Indigenous groups, strengthening the marine evidence base, and bolstering public awareness:
- 33 marine charts completed to improve navigation in key ports,
- over 16,000 KM of coastal imagery collected,
- 5 new state-of-the-art weather buoys deployed,
- 8 pieces of legislation created or revamped to strengthen safety and environmental protections
- 500+ abandoned vessels addressed,
- over 1,900 engagement activities conducted with Indigenous groups,
- signing the first Reconciliation Framework Agreement for Bioregional Oceans Management and Protection,
- 50+ papers, reports, and other materials published on oil spill science,
- 3 POR studies conducted to assess public impressions of marine safety,
- and more (see Appendix F.3)
As seen in Figure 9, of the 336 individual projects announced and tracked through the OPP’s public website,Footnote 21 nearly half fell under Pillar 2 (Preservation and restoration of marine ecosystems). The fewest number of projects were linked to Pillar 3 (Indigenous partnerships); however, many projects under Pillars 1, 2, and 3 involved PDAs partnering with Indigenous groups. Unsurprisingly, OPP activities were mostly focused in coastal areas and the highest concentration of projects was located in the Pacific region, as seen in Figure 10.
Figure 9. OPP projects by pillar

Text version
This pie chart shows the breakdown of projects by OPP Pillar. Thirty-two percent of projects fell under Pillar 1: State-of-the-art marine safety & prevention, 47% fell under Pillar 2: Preservation & restoration of marine ecosystems, 3% fell under Pillar 3: Indigenous partnerships, and 18% fell under Pillar 4: Stronger evidence base, increased community participation & public awareness.
Figure 10. OPP projects by region
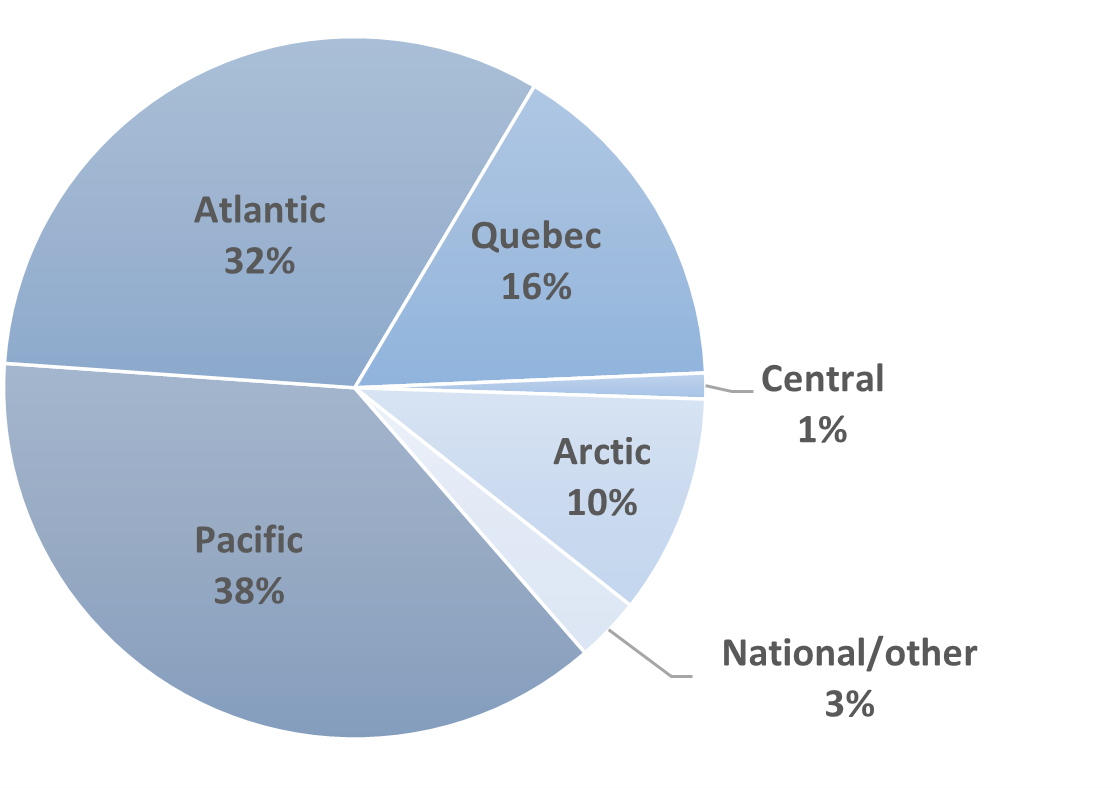
Text version
This pie chart shows the breakdown of OPP projects by region. Thirty-eight percent of projects were in the Pacific, 32% were in the Atlantic, 16% were in Quebec, 10% were in the Arctic, 1% were in the Central region, and 3% were either National or other.
Assessing the achievement of results at the strategic level was more challenging. During the Treasury Board submission phase, PDAs developed six targets linked to key initiatives to track progress towards the OPP’s overall strategic outcome (“A world-leading marine safety system for Canada’s three coasts that protects marine ecosystems”). Three of these targets were met or exceeded:
- Target: 90% of projects funded through Coastal Restoration Fund (CRF) contribution agreements lead to rehabilitation of aquatic habitats
- Result: 100% of CRF-funded projects restored important coastal aquatic habitats, with over 60 projects worth over $70 million funded to date.
- Target: By 2022, a reduction in the number of abandoned, derelict and wrecked vessels present in Canadian waters
- Result: At the time of writing, 545 vessels of concern were addressed, surpassing the planned target of 275.
- Target: By 2022, 100% of policies and operational response plans are supported by scientific, local/traditional, and other relevant information/knowledge
- Result: While progress in this area is harder to quantify, several OPP activities such as gathering input from Indigenous groups and stakeholders, conducting oil spill research, and collecting coastal data suggest that this target has been met (with some aspects being continuous/ongoing).
Work on the fourth target encountered delays, but was on track to meet adjusted timelines:
- Target: By 2027, an increased number of interested Indigenous groups are active partners in Canada’s marine safety system
- Result: Co-development of performance indicators to track Indigenous participation in the marine sector is currently underway (originally planned for 2018)Footnote 22, and outputs from multiple sub-initiatives (such as Building Meaningful Partnerships with Indigenous Groups in Marine Safety, Indigenous Community Response Training, and the Marine Training Program (MTP)) were expected to continue contributing towards this target. For example, over 1000 students were able to participate in courses and programs through the MTP during the OPP’s first iteration, with many securing employment in the marine sector following graduation. There are plans to renew and expand the MTP and related marine educational programming going forward, with the long-term goal of increasing Indigenous participation and generally enhancing the demographic diversity of Canada’s marine industry.
The remaining two targets were either inconclusive or had fallen short of their intended goals/timelines:
- Target: By 2022, a reduction in the number of small oil spills and marine incidents relative to the number of vessel trips, compared with the average of the previous five years
- Result: A high degree of variability in the data addressing this target made it difficult to assess. From 2010-2020, the total volume of marine pollution spills detected each year varied between 1,014 and 9,296 liters, while in 2021, a record high of 17,651 liters was detected; 67% of this volume was the result of just three spills.Footnote 23 The number of vessel trips was not reported, limiting further analysis of oil spill trends. An overview of general marine traffic and accident data from 2015 to 2020 suggested that accident rates (calculated as collisions, groundings, sinkings, etc. per 1M nautical miles sailed), while low overall, declined from 2016 to 2019 before seeing an increase in 2020; see Figure 11.Footnote 24 In general, internal sources agreed that more data was needed to establish longer-term trends and meaningfully assess whether OPP activities had prevented oil spills and marine incidents. OPP staff have also questioned the validity of this target given that it is fairly vague (e.g., what constitutes a “small spill”?) and there are a number of complex factors that can affect spill volumes and accident rates from year to year; for example, the COVID-19 pandemic prompted record sales for the recreational boating industry,Footnote 25 which may have resulted in a greater number of inexperienced non-commercial vessels on the water.
Figure 11. Number of accidents per 1M nautical miles sailed, 2015-2020
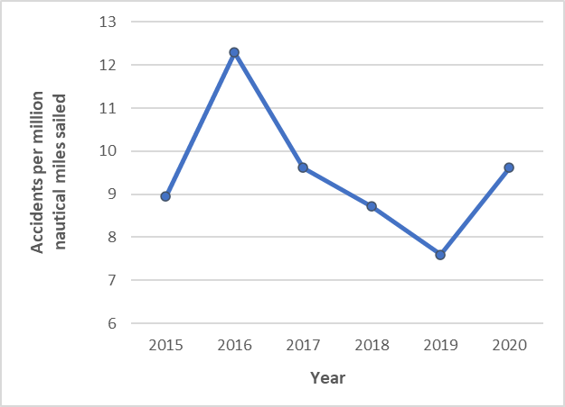
Text version
This line graph tracks changes in the number of accidents per 1 million nautical miles sailed in Canada over time, from 2015 to 2020. In 2015, there were 8.95 accidents per million nautical miles sailed. This number rose to 12.29 in 2016 before falling to 9.62 in 2017, 8.72 in 2018, and 7.59 in 2019. The number rose to 9.62 in 2020.
- Result: A high degree of variability in the data addressing this target made it difficult to assess. From 2010-2020, the total volume of marine pollution spills detected each year varied between 1,014 and 9,296 liters, while in 2021, a record high of 17,651 liters was detected; 67% of this volume was the result of just three spills.Footnote 23 The number of vessel trips was not reported, limiting further analysis of oil spill trends. An overview of general marine traffic and accident data from 2015 to 2020 suggested that accident rates (calculated as collisions, groundings, sinkings, etc. per 1M nautical miles sailed), while low overall, declined from 2016 to 2019 before seeing an increase in 2020; see Figure 11.Footnote 24 In general, internal sources agreed that more data was needed to establish longer-term trends and meaningfully assess whether OPP activities had prevented oil spills and marine incidents. OPP staff have also questioned the validity of this target given that it is fairly vague (e.g., what constitutes a “small spill”?) and there are a number of complex factors that can affect spill volumes and accident rates from year to year; for example, the COVID-19 pandemic prompted record sales for the recreational boating industry,Footnote 25 which may have resulted in a greater number of inexperienced non-commercial vessels on the water.
- Target: By 2022, an increased percentage of Canadians are confident in Canada’s marine safety system
- Result: A series of three TC-funded public opinion research studies conducted by EKOS Research Associates recorded a slight decline in Canadians’ confidence from 2018 to 2022 (see Figure 12).Footnote 26 Overall, levels of confidence were lower among Indigenous groups than the general population. The views of coastal residents varied more over time compared to non-coastal populations, which declined in a more stable manner; this may reflect the higher level of awareness in coastal communities, where residents are more attuned to changes in marine issues and programming. It is worth noting that there were many diverse external factors that could have impacted confidence levels over this period. For example, the influence of the pandemic (which brought increased levels of public scrutiny to the workings of the global supply chain, including marine shippingFootnote 27) and highly publicized environmental issues such as elevated mortalities among North Atlantic right whalesFootnote 28 were arguably beyond the scope of the OPP.
Figure 12. Canadians’ confidence (EKOS data)
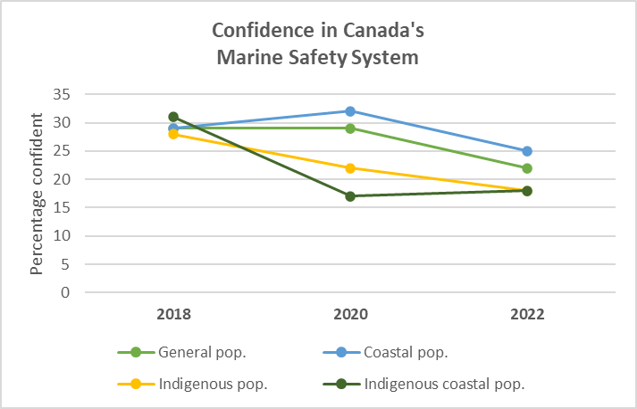
Text version
This line graph tracks changes in the percentage of Canadians who are confident in Canada's Marine Safety System over time, from 2018 to 2022, according to data gathered by EKOS Research Associates. There are 4 lines, each representing confidence in a different segment of the population: General Population, Coastal Populations, Indigenous Population, and Indigenous Coastal Populations. For the general population, 29% were confident in 2018 and 2020, but this number fell to 22% in 2022. For coastal populations, 29% were confident in 2018, 32% in 2020, and 25% in 2022. For the Indigenous population in general, 28% were confident in 2018, 22% in 2020, and 18% in 2022. For Indigenous coastal populations, 31% were confident in 2018, 17% in 2020, and 18% in 2022.
- Result: A series of three TC-funded public opinion research studies conducted by EKOS Research Associates recorded a slight decline in Canadians’ confidence from 2018 to 2022 (see Figure 12).Footnote 26 Overall, levels of confidence were lower among Indigenous groups than the general population. The views of coastal residents varied more over time compared to non-coastal populations, which declined in a more stable manner; this may reflect the higher level of awareness in coastal communities, where residents are more attuned to changes in marine issues and programming. It is worth noting that there were many diverse external factors that could have impacted confidence levels over this period. For example, the influence of the pandemic (which brought increased levels of public scrutiny to the workings of the global supply chain, including marine shippingFootnote 27) and highly publicized environmental issues such as elevated mortalities among North Atlantic right whalesFootnote 28 were arguably beyond the scope of the OPP.
Finding 9: The OPP started an important foundation for longer-term work by building relationships, identifying gaps, developing skills, and contributing to the knowledge of the marine sector.
Multiple sources of evidence suggested that the OPP’s biggest achievement was in providing a foundation for future programing in the marine sector. In fact, some internal and external interviewees felt that it was premature to be measuring the OPP’s impact. To them, the OPP should be framed as one step in a long-term and continuous process, with potential benefits reaching far into the future. Some of the critical pieces of work started under the OPP were:
- Developing relationships and building trust: The impact and reach of many OPP activities depended on PDAs’ ability to establish strong external relationships, especially with Indigenous groups. Although this process was slower and more challenging than expected, the OPP made meaningful gains that will provide a strong basis for future collaboration (assuming PDAs continue to maintain and reinvest in these relationships). This same framing could also be applied to relationships between PDAs, where the OPP provided opportunities to confront the complexities of horizontal work and consider strategies for improvement.
- Identifying gaps and reinvesting in core priorities: OPP investments allowed PDAs to rebuild internal services that had been streamlined during previous budget reductions and bolster key elements of their marine and environmental programming by modernizing/replacing outdated legislation, equipment, and infrastructure. As a result, departments are now better positioned to take on future work.
- Enhancing knowledge, skills and experience within the federal public service: The OPP was a staging area to pilot new technologies and approaches, a key example being the addition of significant Indigenous involvement in areas where programs had previously operated independently. Both TC and CCG invested in internal engagement competency by developing innovative learning activities (in some cases with input/facilitation from Indigenous Elders and other knowledge keepers) which were well received by working-level staff.Footnote 29 Footnote 30 These skills and expertise will continue to benefit PDAs in the future.
- Collecting data and strengthening knowledge: Many of the OPP’s activities involved collecting critical safety and environmental data to inform things like risk management, policy direction, and asset distribution. These new bodies of knowledge and data products will continue to strengthen capacity for the federal government, Indigenous groups, and stakeholders to make evidence-based decisions in the marine sector.
“It’s a continuum. OPP has contributed to the discussion, and now there is more to come.”
These foundational elements started under the OPP have laid the necessary groundwork for future advancements in safety, environmental protection, and Indigenous relations – in a sense, “greasing the wheels” for the next iteration of the OPP. Some interviewees noted that the long-term nature of much of this work sometimes made it challenging to communicate the value of the work to the public and to central agencies.
3.4A Unexpected outcomes
The OPP also contributed to several unintended outcomes, most of which had positive implications for current and future horizontal initiatives. The most common unexpected outcome among internal interviewees was the development of stronger internal and external working relationships. Relatedly, many interviewees observed that the OPP set a new standard for external involvement in marine activities. While most OPP staff agreed that this was an appropriate shift from how things had been done in the past, there was also a recognition that the expectation for outside groups to be involved in marine programming would mean a heavier workload in the future.
Other examples of unintended benefits stemming from OPP activities included innovations in science and technology, such as the use of unmanned survey equipment to monitor whale movements and unplanned uses of data by coastal communities and other groups to support their own internal goals and projects.
3.4B Performance information
Finding 10: While performance information was helpful for project management and decision making, reporting requirements placed a significant burden on working-level OPP staff and did not always provide a meaningful assessment of strategic progress.
As mentioned earlier, the performance data collected under the OPP was valuable for project management and decision making but often onerous to manage from the perspective of working-level staff. Approximately 46% of survey respondents felt that the OPP’s “high degree of administrative/reporting burden” created challenges to a moderate or great extent during implementation. This number was especially high among DFO (63%) and CCG (60%) respondents, indicating that requirements might have been heavier in this department/agency. The frequency and detail of reporting in the early days of the OPP sometimes pulled resources away from delivering project activities, suggesting that some sub-initiatives were not adequately resourced to fulfill the expected administrative requirements.
“We felt like we were living for the next report, but it wasn’t clear why we needed to produce so many. We wanted to focus more on the project than on the reporting requirements.”
The large size and complexity of the OPP meant that there were often multiple layers of oversight and governance structures that project managers had to report to: through their own department, through the lead department, through the Treasury Board Secretariat, and even through other related horizontal initiatives (such as Whales or TMX) in some cases. From the point of view of project managers, a lot of this reporting was similar and potentially duplicative, suggesting that a more efficient and streamlined approach (where performance information was shared between PDAs) might have been possible. It should be noted that senior management within the OPP was aware of these issues and made efforts to reduce the load on working-level staff as the initiative matured, with some evidence of success. A few interviewees observed that reporting requirements eased over time, becoming less frequent once the OPP found its footing.
Some interviewees also felt that they were required to report on performance metrics that were either vaguely defined, invalid, or not aligned with the actual activities of their project or sub-initiative, making it difficult for them to see the value in the exercise. Our earlier analysis of the OPP’s strategic targets underlined the inherent challenges in trying to define and measure success for broad, complex outcomes (such as meaningful Indigenous participation) before a program or initiative is even implemented. Even when logical outcomes are defined, developing meaningful and practical performance indicators and targets is a challenge considering A) the large number of contributing variables and B) the dynamic nature of many marine issues. Even so, selecting appropriate clusters of indicators to measure the value of OPP activities will be increasingly important as the initiative matures and moves into its renewed phase. This work could involve consulting and collaborating with external partners and experts (as is already taking place through the co-development of indicators to assess Indigenous participation) and/or searching the scientific literature for successful models.
“Sometimes it’s hard to marry those big level objectives vs. on-the-ground work and relationships. But that’s what really builds understanding and support and gets us to where we want to be.”
As one of the first horizontal results appendices developed within the Government of Canada, the OPP also illustrated the importance of maintaining oversight of project deliverables while also monitoring progress towards strategic outcomes, which can be challenging when pursuing complex social, cultural, and economic goals. Several internal interviewees felt that reporting and oversight processes within the OPP were largely aimed at the project management level, and the absence of an accompanying outcome-based management approach – cultivating a focus on results, benefits, and business value in addition to budgets, deadlines, and outputsFootnote 31 – hampered the achievement of results. One key interviewee described OPP results reporting as being focused on the trees (i.e., outputs and short-term outcomes) at the expense of the forest (i.e., the medium and strategic outcomes). Going forward, having a better balance between these two elements would likely contribute positively to the achievement of intended outcomes.
3.5 Indigenous inclusion
Finding 11: Although Indigenous engagement was a key priority for many OPP initiatives, Indigenous groups were often seeking a deeper level of collaboration than PDAs were prepared to accommodate.
Engaging and partnering with Indigenous groups was a primary goal of the OPP, with multiple sub-initiatives designed to increase Indigenous involvement in marine protection and response. The Building Meaningful Partnerships with Indigenous Groups in Marine Safety (BMP) sub-initiative, a keystone project which supported many other OPP activities, initially had a goal of having one partnership agreement signed by 2022. This milestone has been surpassed several times over, with a diverse range of arrangements including the Reconciliation Framework Agreement for Bioregional Oceans Management and Protection signed with 17 Nations in the Pacific North Coast bioregion (Oceans RFA; 2018), the OPP Commitment to Action and Results signed with the First Nations Fisheries Council of British Columbia (C2AR; 2019), and over 50 contribution agreements negotiated with DFO-CCG.Footnote 32 Footnote 33
Figure 13. Average ratings of Indigenous involvement (internal survey data)
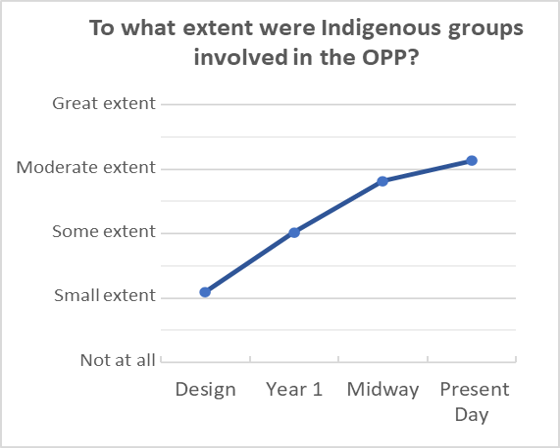
Text version
This bar chart shows average ratings given by all internal survey respondents in response to the question "To what extent were Indigenous groups involved in the OPP?" during different phases of the initiative. On a scale from 0 ("Not at all") to 4 ("Great extent"), respondents gave an average rating of 1.09 for the Design Phase, 2.02 for Year 1, 2.82 for Midway, and 3.13 for Present Day.
A wide spectrum of activities with Indigenous groups took place under the OPP, from participation in open engagement sessions to extensive co-design and delivery of some activities. Figure 13 presents survey ratings of Indigenous involvement over key stages of the OPP; both survey and interview respondents agreed that Indigenous participation was low at the OPP’s outset but rose steadily as the initiative progressed, with high levels of inclusion being reached in the present day. According to a horizontal roll-up of OPP engagement statistics, as of May 2022, 1,937 sessions and workshops that included Indigenous groups were held by OPP PDAs.Footnote 34 As seen in Figure 14, over 60% of activities and exchanges with Indigenous groups tracked through OPPSES involved individual governments (particularly those located in coastal BC). Nearly a third of engagement activities involved either regional or national aggregate groups such as the First Nations Fisheries Council of British Columbia, while national or regional advocacy groups such as the Assembly of First Nations and the Native Women’s Association of Canada accounted for 9% of engagement activities.Footnote 35
Figure 14. Engagement events by Indigenous org. type (OPPSES data)

Text version
This pie chart shows the breakdown of engagement events with Indigenous groups tracked in OPPSES by organization type. Sixty percent of events were held with governments, 29% were held with aggregate organizations, 9% were held with advocacy groups, and 2% were held with industry.
In terms of funding, substantial investments were transferred directly to Indigenous groups over the course of the OPP. As of mid-2021, the Building Meaningful Partnerships (BMP) sub-initiative documented 21 contribution agreements under the Indigenous and Local Communities Engagement and Partnership Program fund totaling $5.8 million, while over $4.1 million in grant funding was approved through TC’s Community Participation Funding Program.Footnote 36 Since its inception, the Indigenous Community Boat Volunteer Program (ICBVP) has provided more than $12M in contribution funding nationally to 40 unique Indigenous recipients to support their efforts in building marine emergency response capacity.
3.5A Outstanding needs
As previously mentioned, many aspects of the OPP were well received by Indigenous groups, especially activities that made direct investments in community environmental and search and rescue capacity (such as the ICBVP), involved communities in program design and decision-making (such as EMSA), and integrated cultural and local knowledge (such as the CEMS sub-initiative). However, there were also indications that some significant gaps remain in meeting the needs of Indigenous communities and organizations in the marine sector:
- Many of the OPP’s most valued activities were implemented as smaller scale or pilot projects and were limited in their geographic scope and impact. Repeated calls to expand successful initiatives and partnerships models as well as the existence of waiting lists for some programs suggests that the level of interest from Indigenous groups sometimes exceeded the OPP’s intended budget and/or scope. To this point, the ICBVP reported that the funding requests it received each year consistently exceeded its budget, while Indigenous groups across Canada expressed interest in the Indigenous Community Response Training program (which was limited to CCG’s Western region).Footnote 37
- As discussed, both departmental and external sources reported that the capacity for groups to fully engage in these programs (whether in terms of time, financial resources, personnel, or training) was a consistent challenge. While PDAs recognized and attempted to address this issue, Indigenous communities and organizations still struggled to manage the volume of requests for consultation and engagement stemming from the OPP and other federal initiatives (including closely linked projects such as the TMX and Whales initiatives).
- While collaborative approaches to program design and delivery were effective and successful, these seem to have been the exception rather than the rule among OPP initiatives. Indigenous groups consistently expressed a desire for a deeper level of involvement in the marine sector and an equal say in decision making at all stages, with some expressing frustration that their involvement started after programs had already been scoped and developed. While some aspects of this issue can be attributed to the current realities of policy development, several internal interviewees felt that a more transparent/collaborative approach in the OPP’s planning phase would have benefited relationships with Indigenous partners and other groups. In some instances, relations were negatively impacted by PDAs taking unilateral action on what were supposed to be collaborative activities.Footnote 38
- Marine safety and environmental concerns among Indigenous groups relating to climate change, increased shipping, and other development activities have not been fully addressed by the OPP. The continuing prominence of this issue in consultation and engagement processes was related to both the traditional stewardship roles embedded in many Indigenous histories and cultures and the increased vulnerability of coastal communities to the impacts of climate change and environmental degradation, especially in the North. For many Indigenous groups, the health of oceans and marine species are intrinsically linked to things like food security, transportation, culture, and identity. Representatives flagged the collection, updating, and sharing of data (for example, on habitat loss, vessel traffic, hazardous and noxious substances being transported through their territories, and the effects of climate change) as key issues requiring action in this area.Footnote 39 Footnote 40
3.5B Trust and relationship-building
“4 years are a very short time for us to build trust … this has been 4 years out of 150. We need more time to prove that we mean what we say.”
Indigenous partners emphasized the critical importance of establishing an open dialogue and being in relationship with communities as a precursor for meaningful engagement within the OPP.Footnote 41 In general, internal documents and interview data indicated that PDAs saw relationship building as foundational to their work with Indigenous communities and organizations. Although a minority of staff suggested that the focus on Indigenous engagement was overemphasized or excessive,Footnote 42 most internal interviewees recognized the value of forming connections with Indigenous groups and tried to take a genuinely collaborative approach to their work. They also recognized that this process would be slow and would require continuous reinvestment, especially considering the trust deficits present in many communities. Given ongoing Indigenous resistance to the TMX pipeline, the OPP’s links to that project may have been an added source of friction that complicated or even prevented engagement with some groups.
While far from universal, feedback from public opinion research and other sources suggested that many Indigenous groups considered engagement under the OPP to be a departure from the familiar communication and interactions of the past and was a promising start towards creating meaningful and effective partnerships (and advancing reconciliation).Footnote 43 Footnote 44 Indigenous participants in the OPP’s renewal process highlighted examples where staff had instilled trust and established meaningful connections by demonstrating genuine care, commitment, and respect for communities.Footnote 45
As mentioned earlier, PDAs directed energy and resources towards training and preparing OPP staff for engagement and partnership activities. Within CCG, this extended to internal representation and hiring practices as a means of establishing ongoing connections at the institutional and personal levels. For example, regional IRP units partnered with Indigenous groups to develop outreach activities aimed at hiring and retaining Indigenous staff, with IRP Central reporting 22 such recruitment events since the program’s inception.Footnote 46 IRP units also funded Marine Liaison Officer positions within communities as a way of establishing a single, continuous point of contact for ongoing relationships with Indigenous partners and formalizing corporate memory. Marine Liaison Officers acted as dedicated resources to alleviate capacity strain, facilitate engagement, communicate communities’ priorities and concerns, and lay the groundwork for future partnership activities. Support for this approach was echoed by Indigenous groups, who emphasized that liaisons should ideally be Indigenous themselves, immersed in the community, and fluent in the local language.Footnote 47 Footnote 48
Some key barriers to relationship-building included:
- Turnover: As discussed, the loss of key staff due to turnover interrupted relationships, particularly when there were no formal processes in place to ensure institutional memory. Partners were sometimes frustrated by the need to repeat themselves with new PDA contacts.Footnote 46
- Limited funding structures: Limited project horizons and the instability of short-term funding were frequently at odds with the goal of ongoing relationship building, creating uncertainty among partners about whether projects would be renewed and making it difficult to build trust. Internal and external sources flagged the identification of stable, ongoing sources of funding as a key support needed to cement fragile relations with Indigenous groups.
Analysis of interview data and internal documentation also indicated that systemic as well as interpersonal bias (i.e., judgmental or dismissive attitudes towards Indigenous partners or culture) may have impeded relationship-building within the OPP in some areas. Support and empowerment of Indigenous employees, cultural awareness and anti-racism training for staff, and stronger awareness/accountability at the senior executive level were identified as key strategies to address these issues within PDAs.Footnote 49
3.5C Navigating barriers to meaningful collaboration
Despite successful trials with co-development on initiatives such as EMSA, there seems to have been resistance and uncertainty around how to adopt these kinds of approaches more broadly. Even within collaborative structures and projects (such as the Oceans RFA or the co-development of indicators process undertaken with the Assembly of First Nations), Indigenous participants sometimes felt that PDAs tended to treat them as consultants instead of true partners, and/or were uncertain about how to meaningfully incorporate Indigenous perspectives.Footnote 50
“There is variation in the extent to which we’re committed to collaboration, and in the success of letting people be involved with the decision-making process. We still grapple with that internally.”
Some sources suggested that this resistance stemmed in part from a generalized aversion to risk within PDAs, which saw the sharing of governance and decision-making powers with Indigenous partners as a threat to colonial order and stability.Footnote 51 Regional response planning processes within the Oceans RFA highlighted difficulties in reconciling the desire to co-develop guidance with Indigenous partners while not allowing extended negotiations to delay the implementation of emergency preparedness plans.Footnote 52 While some internal sources saw these issues as unavoidable growing pains, this perceived conflict between the goals of meaningful collaboration and PDA mandates created challenges when working with Indigenous groups, suggesting a need to prioritize opportunities for compromise and growth in the future.
Other sources of tension included the diversity of viewpoints and priorities among Indigenous groups, which were sometimes difficult for PDAs to understand and navigate. The landscape of traditional territories in Canada is continuously evolving (via Comprehensive Land Claim Agreements) such that jurisdictional boundaries between Nations may be unclear at times – or even in conflict.Footnote 53 Adversarial legal relations between Nations created considerable complexities in implementing the Oceans RFA at some junctures, with some partners threatening to withdraw if others were granted equal footing.Footnote 54 Taking a more tailored, granular (i.e., sub-regional or Nation-by-Nation) approach to engagement and partnerships was frequently urged by Indigenous groups.Footnote 55 Although the choice to engage at a more aggregate level on many OPP activities was likely a result of limited resources and timelines, it still flattened nuances between groups and created ongoing friction with Indigenous partners who were looking for a more bilateral approach.
Lastly, some issues related to cultural disconnects between PDAs and Indigenous groups were raised. A key example of this was the holistic view taken of marine issues by Indigenous groups versus the more siloed, jurisdictionally distinct approach employed by PDAs and individual sub-initiatives. In relation to the CEMS sub-initiative, Indigenous feedback highlighted calls to take a whole-ecosystems approach rather than focusing narrowly on impacts to a single species,Footnote 56 while other sources challenged the OPP’s focus on oceans, ignoring the inherent connection between coastal waters and air, land, ice, and inland channels.Footnote 57 Footnote 54 To this point, recipients through DFO’s Coastal Restoration Fund (CRF) noted that the root causes of threats to coastal areas (such as prey availability for marine species) sometimes lay upstream, within inland watersheds.Footnote 58 One interviewee also highlighted the need for public servants to remove their “bureaucratic armor” and connect with Indigenous partners on a more human level, a concept with which some staff may have been unfamiliar or uncomfortable.
3.5D Best practices for engaging and partnering with Indigenous groups
PDAs and Indigenous groups documented many best practices and lessons learned from engagement and partnership experiences under the OPP.Footnote 43 These learnings touched on a wide range of topics including funding, capacity strain, cultural and legal distinctions, accessibility, the role of Indigenous values and ways of knowing, and more. A selection of best practices synthesized from interview and document review data are included below:
- Identify stable, long-term sources of funding to support ongoing Indigenous participation in marine activities;
- Communicate clearly and as early as possible whether funding will be ended or renewed to reduce uncertainty and allow for long-term planning;
- Where possible, organize face-to-face meetings; visit and spend time in communities and make community-level connections;
- Fund and maintain an up-to-date, centralized record of engagement and partnership activities across all PDAs;
- Deal transparently with partners and manage expectations proactively; don’t over-promise and under-deliver;
- Recognize regional variability, particularly the distinct needs and contexts of Northern communities;
- Consider program impacts on youth, women, and gender-diverse community members, and involve these voices in decision making;
- Engage partners in early stages of program development (i.e., setting priorities, designing activities);
- Allow sufficient time for communities and Nations to review materials and discuss internally prior to meetings and events;
- Prioritize the collection, analysis, and intergenerational transmission of traditional knowledge; respect community ownership and build in protections when sharing culturally sensitive data;
- Integrate traditional knowledge to inform program development and decision making.
For a complete list of best practices for Indigenous engagement and partnerships, see Appendix F.5.
3.6 Stakeholder engagement
While non-Indigenous groups were generally less involved in most OPP initiatives, their participation followed a similar trajectory (and encountered similar barriers) to Indigenous groups. As seen in Figure 15, internal survey data suggested that participation from industry, academia, and other groups was slightly higher than Indigenous involvement during the OPP’s design but increased more modestly over time (compare with Figure 13). As with Indigenous groups, stakeholders found it hard to stay current with the OPP due to competing priorities and parallel engagement processes. This was especially true for smaller entities and those located in remote areas. Again, a more coordinated approach from PDAs would have relieved some of the pressure on stakeholders.
Figure 15. Average ratings of stakeholder involvement (internal survey data)

Text version
This bar chart shows average ratings given by all internal survey respondents in response to the question "To what extent were stakeholders involved in the OPP?" during different phases of the initiative. On a scale from 0 ("Not at all") to 4 ("Great extent"), respondents gave an average rating of 1.62 for the Design Phase, 2.15 for Year 1, 2.61 for Midway, and 2.63 for Present Day.
For most stakeholders, the most valuable aspect of the OPP was the ability to access grants and contributions for data collection and ecosystem restoration activities. For small-scale organizations (such as environmental NGOs) who received funding through the CRF and similar transfer payment programs, OPP investments were transformative. One external interviewee noted that the OPP enabled them to double their organization’s team, purchase critical materials, and establish important connections with other marine stakeholders. Other positive feedback from stakeholders included: A) the creation of forums and events that facilitated networking and created space for critical dialogues (especially opportunities to connect and learn from Indigenous groups); and B) the appreciation for the leadership, knowledge, and flexibility of individual staff, who were praised for moving activities forward through challenging circumstances (especially on the West coast).
External interviewees also identified some key areas for improvement. While OPP funding was appreciated, several interviewees raised concerns about rigid funding and reporting structures and called for greater flexibility in how and when resources could be spent. Given the limits imposed on field work during COVID, some recipients felt strongly that PDAs should allow them to carry over funds from year to year. Others pointed out that although outreach efforts were strong in the OPP’s early days, communications seemed to decrease over time. There was a lack of follow-up information once projects had been completed, leaving partners wondering about the outcome and impact of their contributions; again, the lack of a clear understanding of how ground-level activities linked to strategic goals was an issue. As one interviewee put it, “If we don’t see the results, we may stop providing the data.”
“There are different kinds of stakeholders. You can’t just throw us in a room together, shake us up and hope we’ll figure it out. “
Another recommendation from external interviewees was to take a more tailored approach to engagement activities, where possible, in the future. Many OPP engagement forums and events grouped diverse marine stakeholders together, which sometimes stifled deeper technical conversations and created hesitancy about open information sharing (especially if members of the public were present).Footnote 59 Many stakeholders would have appreciated if PDAs had instead tried to engage with them on a more targeted basis.
Through interviews and document review, some needs/interests among stakeholders emerged that were not fully addressed by the OPP but could guide future policy and programming directions in the marine sector. For example, industry representatives expressed a desire to see PDAs use the OPP to examine and streamline the complex regulatory and jurisdictional landscape affecting commercial shipping.Footnote 60 There were also indications that although the OPP was well aligned with the interests of the Canadian public in many ways, there are still significant misgivings about the transportation of petroleum products and the safety and sustainability of pipeline projects more generally. Public opinion research results suggested that public concerns around these kinds of activities have risen, and an increasing number of Canadians believe that the economic benefits of increased shipping should be weighed carefully against potential environmental risks, corresponding to a rising prioritization of climate change.Footnote 61 To this point, multiple external interviewees referenced climate change as a key consideration in safeguarding the health of marine ecosystems as well as in relation to economic activities (for example, through the effects of extreme weather events on supply chains).
3.7 Overall best practices and lessons learned
The OPP introduced and standardized many new ways of working horizontally and in doing so, provided substantial learning opportunities for the federal government. A selection of best practices and lessons learned drawn from key informant interviews, survey results, and document review are presented below:
- Internal collaboration: Best practices and suggestions for improving federal collaboration included: A) establishing a strong narrative linking initiative-level outcomes to high-level strategic results; B) maintaining a centralized, horizontally integrated, and up-to-date directory and contact list for all OPP initiatives; C) ensuring that mechanisms for horizontal communication and collaboration are in place and functioning at the working level as well as between senior management; D) fostering an open and collaborative approach across branch and PDA lines by emphasizing shared goals; and E) considering retention strategies to minimize interruptions in relationships, workflows, and to maintain corporate memory.
- Engagement and partnerships: Suggestions for strengthening the OPP’s approach to future engagement and partnership efforts included: A) maintaining a centralized, horizontally integrated database for all OPP engagement activities to reduce confusion, duplication, and engagement fatigue; B) where possible, making use of existing forums to reach Indigenous groups and stakeholders; C) maintaining regular communication and keeping Indigenous groups and stakeholders informed of progress via follow-ups; D) tailoring sessions and events to different categories of participants; and E) creating opportunities for networking and shared learning among Indigenous groups and stakeholders.
- Planning and design: To obtain more realistic costing and timelines, many interviewees suggested collecting and integrating feedback from key players prior to designing initiatives, particularly internal services (e.g., HR, Procurement, Finance, Communications, IM/IT, etc.) and Indigenous groups.
- Project vs. outcome management: While maintaining oversight of milestones and activities is important, many interviewees felt that a stronger emphasis on strategic results was needed. A better balance of these two approaches would likely lead to clearer reporting of outcomes and would enhance internal and external understanding of the OPP’s results chain.
- Use and management of data: Some interviewees suggested that deciding how best to harness, share, and protect large datasets collected through the OPP would be important going forward, as would integrating explicit plans for data management into future program design.
- External communications: Suggestions for improving public-facing communications included: A) making training and communication training and tools available at the sub-initiative level to better publicize outcomes and results; B) emphasizing what results and achievements mean for Canadians on a practical level (rather than just listing outputs); C) to the extent possible, standardizing messaging across branches and PDAs; and D) considering the effects of messaging on the expectations of Indigenous groups and stakeholders and crafting early communications to reduce the risk of unmet promises.
- Contingency planning and adaptability: Given the realities of an uncertain and quickly changing world, some interviewees highlighted an increasing need for large-scale projects like the OPP to build in flexibility and capacity to deal with unexpected barriers and delays such as global health events (i.e., pandemics), new technologies, and the effects of climate change.
- Experimentation and innovation: As mentioned, the OPP was unique as a largescale federal program in that it allowed space for experimentation and risk, which was widely appreciated by PDAs, Indigenous groups, and stakeholders.
4.0 Recommendations
- Indigenous capacity and meaningful collaboration
- Recommendation: It is recommended that TC, in collaboration with OPP PDAs, develop and implement a strategy/approach to enhance the coordination and tracking of engagement sessions with Indigenous groups and stakeholders.
- Rationale: A coordinated and consistent approach to engage with Indigenous groups and stakeholders will be important for the renewed OPP to ensure the effectiveness of the engagement efforts and to alleviate capacity strain. Existing tools like the National Integration Model (NIM) and the OPP Stakeholder Engagement Solution (OPPSES) have been effective and there is potential to utilize and enhance the uptake of these tools, as a component of such an approach.
- Results chain/narrative
- Recommendation: It is recommended that TC, in collaboration with OPP PDAs, ensure that a comprehensive results chain and narrative (which includes outcomes, performance indicators, targets, and a data strategy) for the renewed OPP is available and disseminated once the initiative is launched.
- Rationale: Having this tool will provide a variety of benefits. Internally, a logical and well-defined results chain with an accompanying narrative should allow OPP staff to easily comprehend the interconnections between activities and how they contribute to the achievement of long-term results. Further, a well-developed results chain/narrative should help to rationalize reporting requirements, enhance staff engagement, allow the program to gauge the OPP’s performance continuously, enhance agile decision making, and facilitate external communications related to the achievement of results to partners, central agencies, and the Canadian public.
- Horizontal collaboration/communication
- Recommendation: It is recommended that TC, in collaboration with OPP PDAs, develop and/or enhance tools to facilitate collaboration and communication between and within departments to ensure that OPP staff are kept abreast of changes to the OPP organizational structure, changes in personnel, and key decisions taken by senior managers that could impact their work.
- Rationale: These tools would facilitate effective collaboration among internal partners, and could include, but are not limited to, developing and routinely updating a contact list for all OPP sub-initiatives, expanding upon the routine communications sent by departmental Communications teams (e.g., the “OPP Comms Calendar of the Week”), or having OPP secretariats launch a centralized and integrated forum with representatives from all PDAs and from all departmental regions.
| # | Recommendation | Management Action | Responsible lead (ADM level) |
|---|---|---|---|
| 1 |
It is recommended that TC, in collaboration with OPP PDAs, develop and implement a strategy/approach to enhance the coordination and tracking of engagement sessions with Indigenous groups and stakeholders. |
TC, in collaboration with DFO-CCG, ECCC, NRCan, and HC (OPP 2.0 Partner Departments and Agencies (PDAs)), will document its existing OPP engagement strategy for OPP 2.0. This strategy will be disseminated to all relevant internal (to TC) and external (other government departments) OPP Offices of Primary Interest (OPIs). (Estimated Completion Date: Fall 2023) TC’s OPP engagement team will track engagement activities internally through the innovative platform OPPSES, and work with the Digital Services and Transformation Office and Indigenous Relations branch to develop a TC-wide platform/tool – building on the existing platform. (Completed) Interdepartmentally, engagement activities will be tracked through an evergreen engagement calendar and related documentation. (Completed) |
ADMSS |
| 2 |
It is recommended that TC, in collaboration with OPP PDAs, ensure that a comprehensive results chain and narrative (which includes outcomes, performance indicators, targets, and a data strategy) for the renewed OPP is available and disseminated once the initiative is launched. |
Building on the Results Framework in the 2022 OPP Treasury Board Submission, TC will, in collaboration with DFO-CCG, ECCC, NRCan, and HC (OPP 2.0 PDAs), develop a comprehensive results chain and narrative for discussion and dissemination across TC OPIs, and partner departments. The Fall 2023 target would allow for discussions at DG, ADM and DM level to finalize the common product and ensure broad awareness. The common unifying narrative linking the OPP’s diverse initiatives together will build a broad understanding of how individual activities are connected to each other and/or to the OPP’s high-level outcomes. (Estimated Completion Date: Fall 2023) |
ADMSS |
| 3 |
It is recommended that TC, in collaboration with OPP PDAs, develop and/or enhance tools to facilitate collaboration and communication between and within departments to ensure that OPP staff are kept abreast of changes to the OPP organizational structure, changes in personnel, and key decisions taken by senior managers that could impact their work. |
Building on the established interdepartmental governance mechanisms at the DG/ADM and DM levels, among others, TC will refine and develop a governance structure across departments to document accountabilities, interdependencies between initiatives, and information-sharing and decision-making protocols. (Estimated Completion Date: Fall 2023) The OPP Secretariats will hold meetings on a biweekly basis (increasing frequency as needed). At these meetings, OPP Secretariat staff will be kept informed of any changes to the OPP organizational structure, changes in personnel, and key decisions taken by senior management. Secretariats will then disseminate this information within their respective departments. (Completed) A quarterly Manager/Initiative lead level working group will be established at TC. This working group will act as the forum for the OPP Secretariat to provide updates on outcomes from ADM/DG and DM OPP committees, discuss cross-cutting issues, discuss any pertinent risks or mitigation strategies, etc. DFO and ECCC already hold such meetings at their departments, and these will continue. (Completed) The OPP Secretariat at TC will maintain an up-to-date contact list to be shared across departments. The Secretariat has developed a procedure to update the contact list on an ongoing basis. (Completed) |
ADMSS |
5.0 Appendices
Appendix A: Detailed List of OPP Initiatives
Note: Information in this table was pulled directly from OPP planning documents. Some details (e.g., sub-initiative/project names) may differ between PDAs and/or may have evolved over time.
Pillar 1: State of the Art Marine Safety SystemFootnote 62
| Initiatives (total funding amount) | Sub-Initiatives (5-year funding amount; PDAs) | Shared Outcome for Initiatives | Initiative Performance Indicators, Targets and Data StrategiesFootnote 63 |
|---|---|---|---|
|
Real-Time Marine Traffic Information for Indigenous and Coastal Communities (Total $69.7M) |
|
Better Information on Marine Traffic Shared with Indigenous and Coastal Communities |
Performance Indicator: Number of days per year marine traffic information is available to non-federal users (e.g., Indigenous and coastal communities, provinces and mariners) Target:
Data Strategy:
|
|
National Vessel Tracking and Monitoring System (Total $58.9M) |
|
Better Information on Marine Traffic Shared with Indigenous and Coastal Communities |
Performance Indicator: Number of network communication outages Target:
Data Strategy:
|
|
Navigational Information (Total $116.9M) |
|
Safer navigation through better information in mariners' hands |
Performance Indicator #1: Number of key priority areas across the country covered by modern hydrographic information, products and charts Target:
Data Strategy:
Performance Indicator #2: Percentage of project days for which enhanced marine weather forecasts are disseminated Target:
Data Strategy:
|
|
Federal Investments in Safety Equipment and Basic Marine Infrastructure in Northern Communities (Total $94.3M) |
N/A ($94.3M; TC) |
Safer re-supply in Arctic communities |
Performance Indicator: Number of Northern communities with new safety equipment and basic marine infrastructure funded under the Program to Protect Canada's Coastlines and Waterways Target:
Data Strategy:
|
|
Modernize Regulatory and Oversight Framework (Total $57.6M) |
|
Tougher response requirements for industry |
Performance Indicator: Percentage of legislative and/or regulatory amendments that strengthen marine safety and environmental protection Target:
Data Strategy:
|
|
Baseline Data is Available for Northern BC Coast (Total $8.8M) |
N/A ($8.8M; ECCC) |
Enhanced risk-based planning and decision-making |
Performance Indicator: Percentage of priority areas in Northern British Columbia that have ecosystem sensitivity and socio-economic data available Target:
Data Strategy:
|
|
Regional Response Planning (Total $29.4M) |
N/A ($29.4M; TC, CCG, DFO, ECCC) |
Enhanced risk-based planning and decision-making |
Performance Indicator: Number of pilot projects developed that provide lessons learned for incorporation into a national risk-based plan Target:
Data Strategy:
|
|
National Implementation of the Risk-Based Analysis of Maritime Search and Rescue Delivery Methodology (Total $5.5M) |
N/A ($5.5M; CCG) |
Enhanced risk-based planning and decision-making |
Performance Indicator: Number of Search and Rescue areas reviewed using the Risk-Based Analysis of Maritime Search and Rescue Delivery Methodology each year Target:
Data Strategy:
|
|
Federal Oversight of Incident Management (Total $174.4M) |
|
Enhanced federal monitoring, coordination and on-water response capacity |
Performance Indicator: Number of established and operational 24/7 emergency centres Target:
Data Strategy:
|
|
On-Water Presence and Response Capacity (Total $308.8M) |
|
Enhanced federal monitoring, coordination and on-water response capacity |
Performance Indicator: Number of lifeboat stations built to increase the Coast Guard's search and rescue capacity Target:
Data Strategy:
|
|
Increase Emergency Tow Capacity (Total $132.6M) |
N/A ($132.6M; TC, CCG) |
Enhanced federal monitoring, coordination and on-water response capacity |
Performance Indicator: Number of tow kits installed on CCG vessels Target:
Data Strategy:
|
|
Arctic Oversight (Total $80.5M) |
|
Enhanced federal monitoring, coordination and on-water response capacity |
Performance Indicator: Number of inspections in the Arctic compared against inspection plan Target:
Data Strategy:
|
|
Policy Analysis to Move Towards a Seamless, Integrated Response Framework for Spills in Water and To Make Funds Easily Accessible for Response and Clean-Up (Total $25.6M) |
|
Advances towards a seamless response system for all spills in water |
Performance Indicator: Level of compensation available for eligible costs and damage resulting from oil pollution from ships, including clean-up and response costs Target:
Data Strategy:
|
|
Alternative Response Measures (ARMs) (Total $25.8M) |
N/A ($25.8M; TC, CCG, ECCC) |
Advances towards a seamless response system for all spills in water |
Performance Indicator: The number of classes of ARMs that are supported by a legal framework Target:
Data Strategy:
|
Pillar 2: Preservation and Restoration of Marine Ecosystems
| Initiatives (total funding amount) | Sub-Initiatives (5-year funding amount; PDAs) | Shared Outcome for Initiatives | Initiative Performance Indicators, Targets and Data Strategies |
|---|---|---|---|
|
Develop a Coastal Environmental Baseline Monitoring Program to Assess the Cumulative Impacts of Marine Shipping (Total $78.2M) |
N/A ($78.2M; TC, DFO) |
Enhanced knowledge of the cumulative impacts and stressors of marine shipping |
Performance Indicator #1: Number of regional study areas that have baseline information on marine ecosystems Target:
Data Strategy:
Performance Indicator #2: Number of regional study areas where mitigation plans have been developed Target:
Data Strategy:
|
|
Mitigating the Risk of Marine Shipping on the Environment, including Impacts of Underwater Noise from Ships (Total $52.4M) |
|
Expanded knowledge base, and initial capacity to mitigate the risks and impacts of marine stressors and to restore marine ecosystems |
Performance Indicator #1: Number of peer-reviewed or other publications that are published on the stressors and impacts of shipping on marine life and their habitats Target:
Data Strategy:
Performance Indicator #2: Number and types of measures in place to mitigate the impact of stressors on marine mammals and their habitats (DFO) Target:
Data Strategy:
Performance Indicator #3: Number of sites for which scientific data on marine mammals is available to inform vessel traffic management Target:
Data Strategy:
|
|
Conserve or Restore Marine Ecosystems (Total $96M) |
|
Expanded knowledge base, and initial capacity to mitigate the risks and impacts of marine stressors and to restore marine ecosystems |
Performance Indicator #1: Percentage of projects funded through Coastal Restoration Fund contribution agreements leading to rehabilitation of aquatic habitats Target:
Data Strategy:
Performance Indicator #2: Number of coastal detachments that include a fishery officer with training and equipment for marine mammal response (DFO Compliance and Enforcement) Target:
Data Strategy:
|
|
A Comprehensive Strategy for Vessels of Concern (Total $106.8M) |
|
Reduce abandonment of vessels and make progress towards addressing vessels of concern |
Performance Indicator: Number of vessels of concern assessed or addressed, compared to the national database (e.g., removed, remediated or monitored) Target:
Data Strategy:
|
Pillar 3: Indigenous Partnerships
| Initiatives (total funding amount) | Sub-Initiatives (5-year funding amount; PDAs) | Shared Outcome for Initiatives | Initiative Performance Indicators, Targets and Data Strategies |
|---|---|---|---|
|
Facilitating Indigenous Partnerships in the Marine Safety System (Total $39.5M) |
|
Indigenous groups have a formal role and the capacity to participate in Canada's marine safety system |
Performance Indicator: Number of partnerships agreements negotiated with interested Indigenous groups Target:
Data Strategy:
|
|
Enhanced Indigenous and Community Capacity in the Design and Delivery of the Marine Safety and Environmental Protection Measures (Total $66.2M) |
|
Indigenous groups have a formal role and the capacity to participate in Canada's marine safety system |
Performance Indicator: Percentage of Coast Guard Auxiliary members who are provided the Basic Oil Spill Response course Target:
Data Strategy:
|
Pillar 4: Stronger Evidence-base and Increased Community Participation and Public Awareness
| Initiatives (total funding amount) | Sub-Initiatives (5-year funding amount; PDAs) | Shared Outcome for Initiatives | Initiative Performance Indicators, Targets and Data Strategies |
|---|---|---|---|
|
Strengthening Our Understanding of How Oil Products Behave in Water (Total $96.7M) |
|
Better understanding of how oil behaves in water and more effective technologies for spill clean up |
Performance Indicator: Number of scientific publications and products related to oil in the marine environment Target:
Data Strategy:
|
|
Oceans Strategy: A New Governance for Canada's Oceans (Total $3.9M) |
N/A ($3.9M; DFO) |
Improved federal, provincial and Indigenous coordination and planning of marine related activities |
Performance Indicator: Percentage of participation of federal, provincial and Indigenous partners in a governance structure on the Pacific North Coast in support of Oceans Strategy development Target:
Data Strategy:
|
|
Engaging Canadians (Total $5.8M) |
|
Greater public awareness of and confidence in marine safety |
Performance Indicator: Percentage of Canadians who are confident in Canada's marine safety system Target:
Data Strategy:
|
Appendix B: OPP Horizontal Evaluation Matrix
| Evaluation Question | Indicators | Evaluation Method(s) |
|---|---|---|
|
Relevance:
|
|
Document review; Interviews; Survey; Review of documents related to Indigenous inclusion; Case studies |
|
Design:
|
|
Document review; Interviews; Review of documents related to Indigenous inclusion; Case studies |
|
Federal collaboration:
|
|
Document review; Data review; Interviews; Survey; Case studies |
|
Process/Implementation:
|
|
Document review; Data review; Interviews; Survey; Review of documents related to Indigenous inclusion; Case studies |
|
Progress:
|
|
Document review; Data review; Interviews; Survey; Review of documents related to Indigenous inclusion; Case studies |
|
Indigenous Inclusion:
|
|
Interviews; Data review; Review of documents related to Indigenous inclusion; Case studies |
|
Stakeholder Engagement:
|
|
Document review; Interviews; Case studies |
|
Lessons Learned:
|
|
Document review; Interviews; Survey; Review of documents related to Indigenous inclusion; Case studies |
Appendix C: Key Informant Interview Questions
Internal Interview Questions
Note: For questions 2, 3, 4, 5, 8, 10, and 11 of this interview guide, informants were invited to respond using a scale with the following options:
- Not at all
- To a small extent
- To some extent
- To a moderate extent
- To a great extent
- I don't know
- Please briefly introduce yourself and describe your role and responsibilities as they relate to the OPP. How long have you been involved in this work?
-
To what extent is the OPP meeting the needs of the following groups? Please explain your response.
i. Internal (i.e., federal) partners
ii. Indigenous organizations and communities
iii. Other external partners and stakeholders- Are there any gaps that remain?
- To what extent was the OPP's design appropriate to facilitate the achievement of expected results? Please explain your response.
- What were some of the strengths and weaknesses of the OPP's design?
- To what extent has collaboration within the department been effective? Please explain your response.
- Please rate to what extent the following aspects of collaboration have been effective.
- OPP governance mechanisms
- Clearly defined roles and responsibilities
- Level of communication
- How could collaboration within the department be improved?
- Please rate to what extent the following aspects of collaboration have been effective.
- To what extent has collaboration with partner departments been effective? Please explain your response.
- Please rate to what extent the following aspects of collaboration with partner departments have been effective.
- OPP governance mechanisms
- Clearly defined roles and responsibilities
- Level of communication
- How could collaboration across partner departments be improved?
- Please rate to what extent the following aspects of collaboration with partner departments have been effective.
- What were the main challenges related to the implementation of the OPP? Please explain.
- In general, were initiatives appropriately resourced (e.g., sufficient staff, tools, training, etc.) so that the required activities/results could be completed?
- Have there been any other factors, internal or external, that hindered or facilitated the implementation of OPP?
- To what extent has the OPP achieved (or is in a position to achieve) its intended strategic results? Please explain your response.
- Has the performance data that has been collected and reported on been adequate to support effective management and decision making?
- Have there been any unexpected outcomes, either positive or negative, that have resulted from the OPP?
- To what extent were Indigenous communities and organizations involved with the OPP during the following periods of time? Please explain your response.
- Design
- Implementation - Year 1
- Implementation – Midway
- Present Day
- To what extent were external stakeholders (e.g., industry, NGOs, academia, the public, other levels of government, non-Indigenous coastal communities) engaged in the OPP during the following periods of time? Please explain your response.
- Design
- Implementation - Year 1
- Implementation – Midway
- Present Day
- What best practices and lessons learned does the OPP offer for the future planning of similar federal horizontal initiatives?
- That concludes our formal questions. Are there any other thoughts that you would like to share before we end the interview?
External Interview Questions
Note: For questions 2 and 4 of this interview guide, informants were invited to respond using a scale with the following options:
- Not at all
- To a small extent
- To some extent
- To a moderate extent
- To a great extent
- I don't know
- Please describe your organization's role in the marine sector and your involvement with the Oceans Protection Plan. How long have you been involved in this work?
- What are your organization's top priorities regarding marine safety and/or protection of marine ecosystems?
- To what extent have these priorities been addressed by the OPP?
-
Please describe your experience of engaging with the federal government through the OPP. What kinds of activities did you take part in (if any)?
i. Accessed public information (e.g., through the OPP website)
ii. Received direct communications from OPP staff
iii. Attended engagement sessions
iv. Provided feedback on proposed OPP programming or policy (e.g., consultation)
v. Worked directly with the OPP to help deliver a specific program (e.g., partnership)
vi. Received grants or contribution funding
vii. Other:- Were there any key factors that either facilitated or limited your ability to participate?
- In your opinion, to what extent has the OPP made progress towards the following goals?
- Enhancing the marine safety system
- Protecting marine ecosystems
- What important insights do you think the OPP offers for the planning of future government initiatives involving marine stakeholders?
- That concludes our formal questions. Is there anything else you would like to share about your experiences with the OPP?
Appendix D: Internal Survey Questions
Note: For questions in the Relevance, Design, Collaboration, Implementation, Expected Results, Indigenous Inclusion, and Stakeholder Engagement sections of this survey, respondents were invited to respond using a scale with the following options:
- Not at all
- To a small extent
- To some extent
- To a moderate extent
- To a great extent
- I don't know
- Not applicable
Background
Tell us a little about your area of responsibility.
Please select the partner department/agency you worked for most recently while involved with the OPP:
- Transport Canada (TC)
- Fisheries and Oceans Canada (DFO)
- Canadian Coast Guard (CCG)
- Environment and Climate Change Canada (ECCC)
- Natural Resources Canada (NRCan)
Please select the TC region(s) you worked in while involved with the OPP:
- Atlantic
- Quebec
- Ontario
- Pacific
- Prairies
- Arctic
- NCR – National capital region
Please indicate which OPP area you have been involved with, in either an activity-based or supportive capacity (select the one that most applies):
- Sub-initiatives contributing to OPP Pillars
- OPP Secretariat
- Facilitating Indigenous and stakeholder engagement
- Enabler role (such as Corporate Services, like Finance, HR, and IT)
- I don't know
- Other; if ‘Other', please specify
Please indicate which OPP sub-initiatives you have been involved with at TC (select all that apply):
- Pillar 1: State of the Art Marine Safety System
- Enhanced Maritime Situational Awareness
- Space Based Automatic Information System
- Federal Investments in Safety Equipment and Basic Marine Infrastructure in Northern Communities
- Canada's Regulatory and Enforcement Regime and International Influence
- Proactive Vessel Management
- Pilotage Act Review
- TERMPOL
- Places of Refuge
- Regional Response Planning
- 24/7 emergency response capacity to effectively manage marine incidents
- Incident Command System
- Legislative Changes to Provide CCG with Clarified Authorities for Ship-Source Pollution Incidents
- Increase Emergency Tow Capacity
- Build/Lease a Hangar in Iqaluit
- Expanded Northern Marine Safety Oversight
- Engagement, Policy and Coordination for Seamless Response
- Making Funds Easily Accessible for Response and Cleanup
- Establishing a National Framework to Respond to Hazardous and Noxious Substances (HNS) from ships
- Alternative Response Measures (ARMs)
- Pillar 2: Preservation and Restoration of Marine Ecosystems
- Develop a Coastal Environmental Baseline Monitoring Program to Assess the Cumulative Impacts of Marine Shipping
- Establishing Marine Environmental Quality Regulatory and Non-Regulatory Measures
- Vessels of Concern: New Legislation
- Vessels of Concern: Improve Owner Identification and Create Vessel Remediation Funds
- Vessels of Concern: Support the Removal of Small Legacy Vessels
- Vessels of Concern: Education and Outreach
- Vessels of Concern: Research to Advance Vessel Recycling and Design for Environment
- Pillar 3: Indigenous Partnerships
- Building Meaningful Partnerships with Indigenous Groups in Marine Safety
- Northern Marine Transportation Corridors and Governance for the Arctic Shipping Regime
- Marine Training Program
- Pillar 4: Stronger Evidence-base and Increased Community Participation and Public Awareness
- Conduct community discussions to encourage Canadians to play a stronger role in marine safety and environmental protection
- Engage Canadians so they better understand Canada's marine safety system
Please select the DFO region(s) you worked in while involved with the OPP:
- Newfoundland and Labrador
- Maritimes
- Gulf
- Quebec
- Arctic
- Pacific
- Ontario and Prairie
- National Capital Region
Please select the CCG region(s) you worked in while involved with the OPP:
- Atlantic
- Central
- Arctic
- Western
- National Capital Region
Please indicate which OPP sub-initiatives you have been involved with (select all that apply):
- Pillar 1: State of the Art Marine Safety System
- Operational Network (OpNet)
- Additional Radar Sites
- Modern Hydrography and Charting in Key Areas
- TERMPOL
- Regional Response Planning
- National Implementation of the Risk-Based Analysis of Maritime Search and Rescue Delivery Methodology
- 24/7 emergency response capacity to effectively manage marine incidents
- Purchase and Deployment of Mobile Command Post
- MCTS Staffing Factor
- Legislative Changes to Provide CCG with Clarified Authorities for Ship-Source Pollution Incidents
- Increase On-Scene Environmental Response Capacity
- Six new Search and Rescue Lifeboats and In-shore Rescue Boat
- Modernize CCG Environmental Emergency Response Equipment
- New Staffed Logistic Depot Near Port Hardy in BC
- Increase Emergency Tow Capacity
- CCG Arctic Presence
- Making Funds Easily Accessible for Response and Cleanup
- Alternative Response Measures (ARMs)
- Pillar 2: Preservation and Restoration of Marine Ecosystems
- Develop a Coastal Environmental Baseline Monitoring Program to Assess the Cumulative Impacts of Marine Shipping
- Reducing the Threat of Vessel Traffic on Whales and Other Marine Mammals through Detection and Avoidance
- Establishing Marine Environmental Quality Regulatory and Non-Regulatory Measures
- Coastal Restoration Fund
- Marine Mammal Response and Marine Protected Areas Surveillance and Enforcement Program
- Vessels of Concern: Support the Removal of Small Legacy Vessels
- Vessels of Concern: New Legislation
- Vessels of Concern: Improve Owner Identification and Create Vessel Remediation Funds
- Vessels of Concern: Risk-Based Strategy to Address Vessels of Concern
- Pillar 3: Indigenous Partnerships
- Building Meaningful Partnerships with Indigenous Groups in Marine Safety
- Northern Marine Transportation Corridors and Governance for the Arctic Shipping Regime
- Indigenous Community Response Teams
- Coast Guard Auxiliary Chapter in the Arctic and Community Boats Expansion
- Pillar 4: Stronger Evidence-base and Increased Community Participation and Public Awareness
- Improving Drift Prediction and Near-shore Modelling
- Establish a Multi-partner Oil Spill Response Technology Research for Spill Clean-up
- Oceans Network Canada—Oceanographic Radar and Hydrophone Support
- Expand Research on Fate, Behaviour and Biological Impact
- Oceans Strategy: A New Governance for Canada's Oceans
Please select the ECCC region(s) you worked in while involved with the OPP:
- National
- Atlantic
- Quebec
- Ontario
- Great Lakes
- Pacific
- Prairies
- Northern regions
Please indicate which OPP sub-initiatives you have been involved with at ECCC (select all that apply):
- Pillar 1: State of the Art Marine Safety System
- Marine Weather Information Services Demonstration Project
- Baseline Data is Available for Northern BC Coast
- Regional Response Planning
- 24/7 emergency response capacity to effectively manage marine incidents
- Alternative Response Measures (ARMs)
Please select the NRCan region(s) you worked in while involved with the OPP:
- National Office
- CanMET Devon
- Other; if ‘Other', please specify:
Please indicate which OPP area you have been involved with at NRCan, in either an activity-based or supportive capacity (select the one that most applies):
- OPP Pillar 4: Expand Research on Fate, Behaviour and Biological Impact
- OPP Secretariat
- Facilitating Indigenous and stakeholder engagement
- Enabler role (such as Corporate Services, like Finance, HR, and IT)
- I don't know
- Other; if ‘Other', please specify:
Please indicate which role best reflects your involvement with the OPP:
- Sub-initiative Manager or Team Lead
- Director
- Director General
- Other; if ‘Other', please specify:
Please indicate during which fiscal years you have been involved with the OPP:
- 2016-17
- 2017-18
- 2018-19
- 2019-20
- 2020-21
- 2021-22
Relevance
For the remaining questions, please provide a rating based on your overall experience across the different OPP initiatives that you have been involved with and focus on the status of these initiatives in the present day.
To what extent is the OPP meeting the needs of the following groups?
- Internal (i.e., federal) partners
- Indigenous organizations and communities
- Other external partners and stakeholders (Other external partners and stakeholders include industry, NGOs, academia, the public, other levels of government, non-Indigenous coastal communities, etc.)
Optional follow-up: If you responded "not at all", "to a small extent" or "to some extent", what are the main gaps that remain?
Design
In your view, to what extent was the OPP's design appropriate to facilitate the achievement of its intended strategic outcome and targets?
Optional follow-up: If you responded "not at all", "to a small extent" or "to some extent", how could the OPP's design have been improved?
Collaboration
Overall, to what extent has collaboration within your department been effective?
Optional follow-up: If you responded "not at all", "to a small extent" or "to some extent", how could collaboration within your department have been improved?
Please rate to what extent each of the following aspects of collaboration within your department have been effective.
- OPP governance
- Clearly defined roles and responsibilities
- Level of communication
Overall, to what extent has collaboration with OPP partner departments been effective?
Optional follow-up: If you responded "not at all", "to a small extent" or "to some extent", how could collaboration between OPP partner departments have been improved?
Please rate to what extent each of the following aspects of collaboration with other OPP partner departments have been effective.
- OPP governance
- Clearly defined roles and responsibilities
- Level of communication
Implementation
Please rate the extent to which each of the following factors created challenges for the implementation of the OPP:
- Insufficient time budgeted for building external relationships
- Inadequate resourcing/funding
- High levels of staff turnover
- Lack of access to appropriate training
- Inadequate consideration of GBA+ issues (Gender Based Analysis+/GBA+ refers to how diverse groups of people may experience policies, programs and initiatives on the basis of gender, race, ethnicity, age, etc.)
- Delays related to COVID-19
- Difficulty understanding the OPP results chain (an understanding of how activities of a particular sub-initiative will lead/contribute to the OPP's desired strategic outcome and/or targets)
- Difficulties stemming from differing partner department mandates and cultures
- High degree of administrative/reporting burden
- Difficulties with procurement
Have any other factors (either internal or external) hindered the implementation of the OPP?
- Yes (If you responded "yes", please specify the hindering factors)
- No
- I don't know
Have any factors (either internal or external) facilitated the implementation of the OPP?
- Yes (If you responded "yes", please specify the facilitating factors)
- No
- I don't know
Expected Results
In your view, to what extent is the OPP on track to achieve its intended strategic outcome and targets?
Optional follow-up: If you responded "not at all", "to a small extent" or "to some extent", what could have been done differently to ensure the achievement of strategic results?
To what extent has the performance data that has been collected and reported been adequate to support effective management and decision making?
Optional follow-up: If you responded "not at all", "to a small extent" or "to some extent", how could performance data have been improved?
Indigenous Inclusion
To what extent were Indigenous organizations and communities involved with the OPP during the following periods?
- Design
- Implementation – Year 1
- Implementation – Midway
- Present Day
Optional follow-up: If you responded "not at all", "to a small extent" or "to some extent", what factors limited Indigenous involvement?
Please rate the extent to which the following aspects of Indigenous inclusion have been effective:
- Identifying the appropriate partners
- Accurately capturing feedback
- Providing timely and accessible communication
- Coordinating engagement activities with other initiatives, departments, and agencies
- Adequate preparation for engagement (e.g., cultural competency, familiarity with important local issues)
- Supporting community capacity to participate (support in the form of training, tools, resources)
- Respect and consideration for traditional/local knowledge (making use of the traditional/local knowledge to support the OPP strategic outcome and/or targets)
- Building meaningful partnerships (i.e., going beyond simply informing/consulting)
Stakeholder Engagement
To what extent were other external partners and stakeholders engaged with the OPP during the following periods? Other external partners and stakeholders include industry, NGOs, academia, the public, other levels of government, non-Indigenous coastal communities, etc.
- Design
- Implementation – Year 1
- Implementation – Midway
- Present Day
Optional follow-up: If you responded "not at all", "to a small extent" or "to some extent", what factors limited the involvement of other external partners and stakeholders?
Please rate the extent to which the following aspects of engaging with other external partners and stakeholders have been effective:
- Identifying the appropriate partners
- Accurately capturing feedback
- Providing timely and accessible communication
- Coordinating engagement activities with other initiatives, departments, and agencies
Lessons Learned
What best practices and lessons learned does the OPP offer for the future planning of similar federal horizontal initiatives?
If you have any other thoughts that you would like to share in relation to the OPP, please provide details:
Thank you
Thank you for your insights! Your responses have been recorded.
Appendix E: OPP Groups
OPP groups:
- PDAs
- TC
- DFO/CCG
- ECCC
- NRCan
- Indigenous groups
- Aggregate organizations
- Individual communities
- Etc.
- Stakeholders
- Industry
- Academia
- NGOs
- Federal authorities
- Other levels of government
- Canadian public
- Etc.
Appendix F: Supplementary Tables and Figures
F.1 Collaboration Ratings
Average ratings of communication by PDA (internal survey data)
Note: NRCan data too limited for meaningful comparison
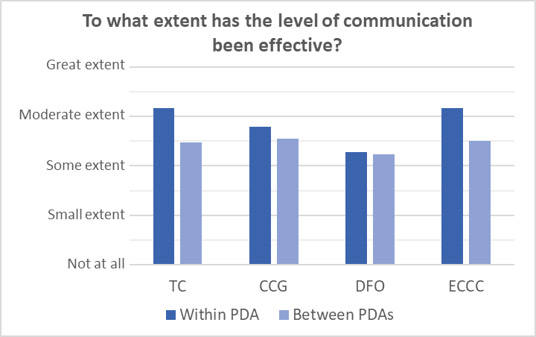
Average ratings of governance mechanisms by PDA (internal survey data)
Note: NRCan data too limited for meaningful comparison
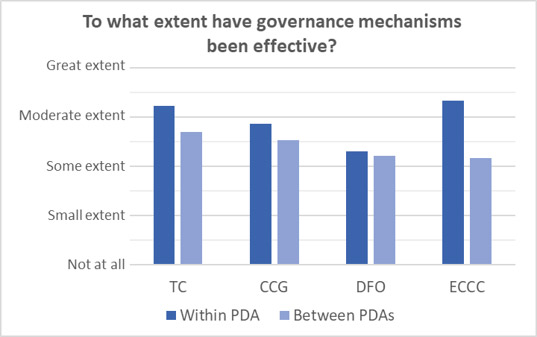
Average ratings of roles and responsibilities by PDA (internal survey data)
Note: NRCan data too limited for meaningful comparison
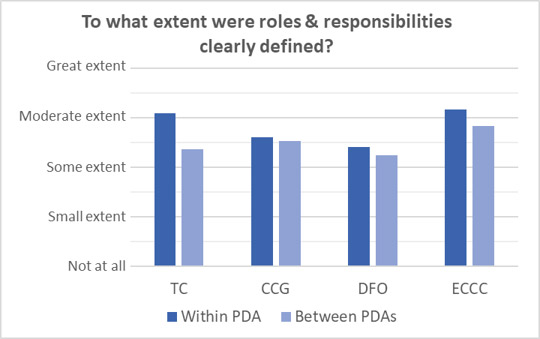
F.2 Implementation Factors
The table below presents hindering and facilitating factors that significantly impacted the OPP's implementation as per survey, interview, and document review evidence.
| Internal or external? | Hindered | Facilitated |
|---|---|---|
| Internal to PDAs |
|
|
| External to PDAs |
|
|
F.3 Supplementary Results Tables
Status of OPP 1.0 sub-initiative targets
| Target status | # | % |
|---|---|---|
| Met or exceeded | 23 | 40 |
| On track | 7 | 12 |
| Delayed | 10 | 18 |
| Info missing or unclear | 17 | 30 |
The table below presents examples of tangible outputs achieved under the OPP's first phase.
Examples of concrete achievements under OPP 1.0 in key strategic areas
| Key Strategic Area | Achievements |
|---|---|
| Funding |
|
| Improving marine emergency response |
|
| Greater protections for marine species & ecosystems |
|
| Increasing Indigenous & Coastal community collaboration |
|
| Strengthening the evidence base |
|
| Increasing public awareness & confidence |
|
F.4 Supplementary Financial Figures
Of the $245M in funding that was reprofiled/redirected/reallocated over a four-year period from FY 18/19 to FY 21/22, approximately $130M was found at TC and $112M was found at DFO-CCG:
Funds to be reprofiled/redirected/reallocated by PDA and fiscal year (in millions)Footnote 67
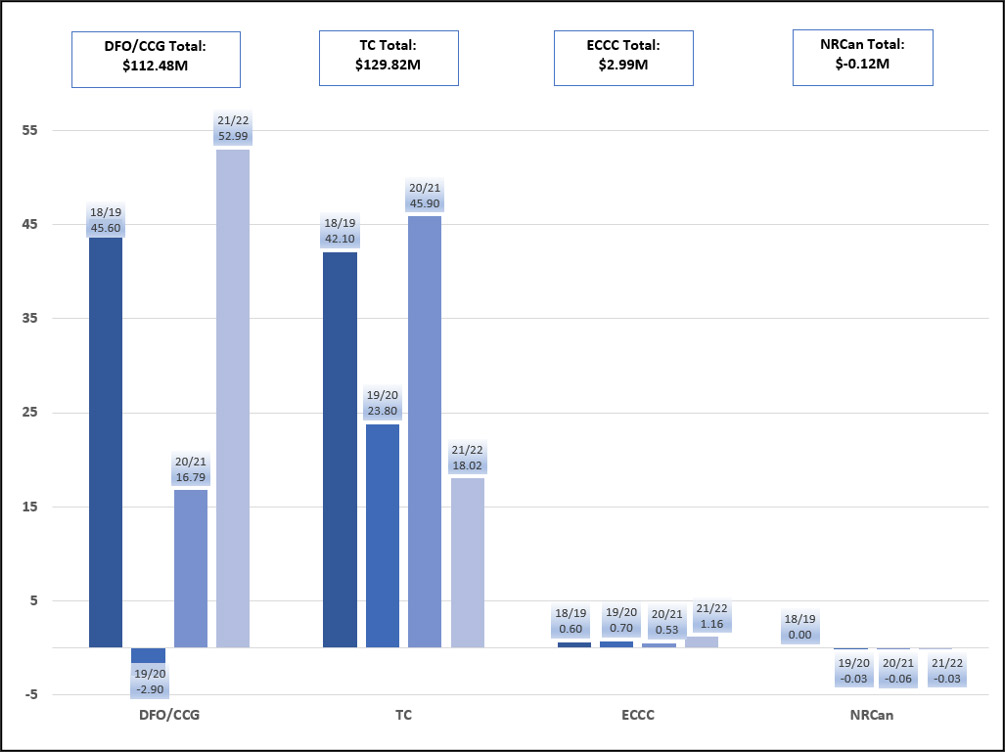
A large majority (88%) of this $245M amount was located under Pillar 1: State-of-the-Art Marine Safety System:
Funds to be reprofiled/redirected/reallocated by OPP Pillar (in millions)Footnote 68

F.5 Best practices for Indigenous engagement
The table below presents best practices for Indigenous engagement synthesized from interviews, survey, and document review evidence.
| Domain | Best practices |
|---|---|
| Funding |
|
| Forming connections and relationships |
|
| Capacity |
|
| Meaningful collaboration (co-design, co-delivery, co-management) |
|
| Respecting cultural, regional, & legal distinctions |
|
| Inclusivity & accessibility |
|
| Traditional & local knowledge |
|